About reference lines
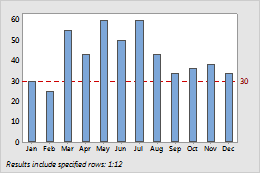
You can add reference lines to most Minitab graphs. The reference line on this bar chart of monthly sales represents sales quotas.
Reference lines are displayed behind data displays and may be difficult to see with some graphs, such as histograms. To create a reference line that sits in front of the graph's data display, use a calculated line instead. Go to Calculated lines.
Note
You must use the scale units on the graph to position the reference lines. For example, if the y-scale has been transformed so that the tick marks are displayed in transformed units, you must enter the reference line position in the transformed units.
Add reference lines when you create a graph
You can add reference lines when you create a graph.
- In the dialog box for the graph you are creating, click Scale.
- Click the Reference Lines tab.
- Specify the reference line positions and click OK.
Add reference lines to an existing graph
You can add reference lines to an existing graph.
- Double-click the graph.
- Right-click the graph and choose .
- Specify the reference line positions and click OK.
Edit reference lines
After you add a reference line, you can change its color, size, and type.
- Double-click the graph.
- Double-click the reference line.
-
Select the tab to make the edits that you want.
- Attributes: Change the color, size, or line type.
- Show: Hide the label or specify whether to show it on the high side or the low side of the graph.
Edit reference line labels
By default, the reference line includes a label on the high side of the graph.
- Double-click the graph.
-
Double-click the reference line label.
Tip
Click and drag to move a label.
-
Select the tab to make the edits that you want.
- Font: Change the text, size, color, style, or font.
- Show: Hide the label or move it to the other side of the graph.
- Alignment:
Change the text angle, the position, and the offset of the label. See the
following examples:
- Text angle
-
Rotate the label, for example to make adjacent labels easier to read.
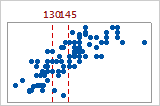
Text angle = 0 (default)
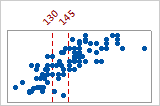
Text angle = 45
- Position
- Change the position of the label relative to the point where
the axis line and the reference line intersect (also called the anchor point).
Under
Position,
choose
Custom,
then choose a position. For example, in the second ECDF plot below, the
position of the top label is
Above, to the right
and the position of the bottom label is
Below, to the right.
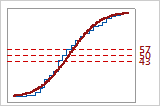
Default label positions
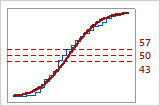
Custom label positions
- Offset
- Move the label horizontally or vertically relative to its
current position. Under
Offset,
choose
Custom,
then specify the horizontal or vertical distance to move the label. For
example, in the second bubble plot, the vertical offset of –0.06 makes the
reference line label and the axis label easier to read.
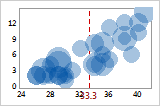
Default label offset
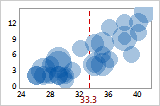
Vertical offset = –0.06