Use Area Graph to plot the cumulative sum of groups in time order and evaluate how each group contributes to the whole. Area graphs display multiple time series stacked on the y-axis against equally spaced time intervals on the x-axis. Each line on the graph is the cumulative sum, so that you can see each series' contribution to the sum and how the composition of the sum changes over time.
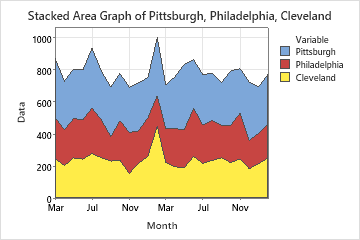
For example, the following area graph shows the monthly sales of a major retail chain at three stores over two years.
Where to find this graph
To create an area graph, choose .