Create data for a function and then create a graph of the data.
- Choose .
- Choose .
- Under Store in, type X in the first box and type Y in the second box.
- In Store Z variable in, type Z.
- Select Use function example, then select Egg Carton.
- Click OK.The X, Y, and Z data are now in the worksheet.
- To create a 3D surface plot of the X, Y, and Z data, follow these steps:
- Choose .
- In Z variable, enter Z.
- In Y variable, enter Y.
- In X variable, enter X.
- Click OK.
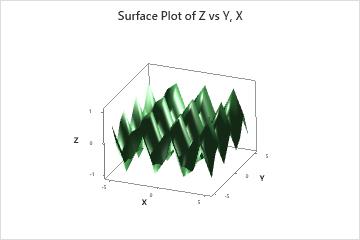
Results
The worksheet contains the generated X, Y, and Z data for the egg carton function. The surface plot displays the data for the function.
| C1 | C2 | C3 |
|---|---|---|
| X | Y | Z |
| −5 | −5 | 0.544021 |
| −4 | −5 | −0.222669 |
| −3 | −5 | 0.411718 |
| ... | ... | ... |