Step 1: Examine the calculated values
Using the values of the three power function variables that you entered, Minitab calculates the number of replicates, the effect size, the power of the design, or the number of center points.
- Effect
-
If you enter the number of replicates, the power value, and the number of center points, Minitab calculates the effect. The effect is the difference in the response between the high and low levels of a factor that you want the design to detect. This difference is the result of one factor alone (main effect).
- Center points
-
If you enter the number of replicates, the effect size, and the power value, Minitab calculates the number of center points. Center points are experimental runs with all factor levels set halfway between the low and high settings. Center points are mainly used to detect curvature effects, but adding more center points can also increase the power somewhat.
- Replicates
- If you enter the effect size, the power value, and the number of center points, then Minitab calculates the number of replicates. Replicates are multiple experimental runs with the same factor settings. Because the number of replicates is an integer value, the actual power may be slightly greater than your target value.
- Total runs
- For every case, Minitab calculates the total runs from the number of replicates and the number of center points. The total number of runs is the product of the number of corner points and the number of replicates, plus the number of center points.
- Power values
- If you enter the number of replicates, the effect size, and the number of center points, Minitab calculates the power value. Power is the probability that you will correctly find a significant effect. A power value of 0.9 is usually considered enough. A value of 0.9 indicates that you have a 90% chance of detecting an effect. Usually, when the total number of runs is smaller or the effect is smaller, then the design has less power.
Method
| Factors: | 15 | Design: | 32 |
|---|---|---|---|
| Center pts (total): | 0 |
Results
| Center Points | Effect | Reps | Total Runs | Target Power | Actual Power |
|---|---|---|---|---|---|
| 0 | 2.0 | 1 | 32 | 0.8 | 0.877445 |
| 0 | 2.0 | 2 | 64 | 0.9 | 0.995974 |
| 0 | 0.9 | 4 | 128 | 0.8 | 0.843529 |
| 0 | 0.9 | 5 | 160 | 0.9 | 0.914018 |
Key Results: Center Points, Effect, Reps, Total Runs, Target Power, Actual Power
In these results, Minitab calculates the number of replicates to reach the target power. The design that detects an effect of 2 with a power of 0.8 requires 1 replicate. To achieve a power of 0.9, the design requires 2 replicates. The actual power with 2 replicates is greater than 0.99. This actual power is the smallest power value that is greater than or equal to 0.9 and obtainable using an integer number of replicates. To detect the smaller effect of 0.9 with 0.8 power, the design requires 4 replicates. To detect the smaller effect of 0.9 with 0.9 power, the design requires 5 replicates.
Step 2: Examine the power curve
Use the power curve to assess the appropriate properties for your design.
The power curve represents the relationship between power and effect size, for every combination of center points and replicates. Each symbol on the power curve represents a calculated value based on the properties that you enter. For example, if you enter a number of replicates, a power value, and a number of center points, then Minitab calculates the corresponding effect size and displays the calculated value on the graph for the combination of replicates and center points. If you solve for replicates or center points, the plot also includes curves for other combinations of replicates and center points that are in the combinations that achieve the target power. The plot does not show curves for cases that do not have enough degrees of freedom to assess statistical significance.
Examine the values on the curve to determine the effect size that the experiment detects at a certain power value, number of corner points, and number of center points. A power value of 0.9 is usually considered adequate. However, some practitioners consider a power value of 0.8 to be adequate. If a design has low power, you might fail to detect an effect that is practically significant. Increasing the number of replicates increases the power of your design. You want enough experimental runs in your design to achieve adequate power. A design has more power to detect a larger effect than a smaller effect.
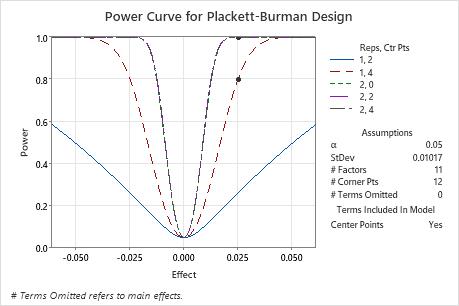
In these results, Minitab calculates the number of replicates to achieve a target power of at least 0.8 or 0.9 for an effect size of 0.025. The designed experiment has 12 corner points to study 11 factors. The calculations consider designed experiments with 0, 2, or 4 center points. The curve that shows 1 replicate with 4 center points has a symbol for the effect of 0.25 where the power is higher than the target power of 0.8. The 3 curves that represent experiments with 2 replicates have symbols that show that the power to detect an effect of 0.025 is larger than the target power of 0.9.
Because a solution exists with 2 replicates and 2 center points and a solution exists with 1 replicate and 4 center points, the plot also includes a curve for an experiment with 1 replicate and 2 center points. This experiment does not achieve either target power for the effect of 0.025, so this curve does not have a symbol. The plot does not include the curve for 1 replicate with 0 center points because this experiment does not have enough degrees of freedom to assess statistical significance when 0 terms are omitted from the model.