Ratio

Notation
| Term | Description |
|---|---|
| ρ | Ratio |
 | Test mean |
 | Reference mean |
Equivalence limits
Let k1 be the value that you specify for the lower limit and k2 be the value that you specify for the upper limit. By default, the lower equivalence limit, δ1, is given by:

and the upper equivalence limit, δ2, is given by:

Degrees of freedom (DF)

Notation
| Term | Description |
|---|---|
| v | Degrees of freedom |
| n | Number of pairs of observations |
S12
Notation
| Term | Description |
|---|---|
| Xi | The ith observation in the test sample, such that (Xi, Yi) is the ith pair of observations |
| Yi | The ith observation in the reference sample, such that ( Xi, Yi) is the ith pair of observations |
 | Mean of the test sample |
 | Mean of the reference sample |
| n | Number of pairs of observations |
Confidence interval
Minitab cannot calculate the confidence interval (CI) if either of the following two conditions are satisfied:
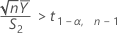
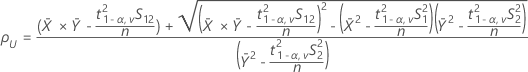
- 100(1 - α)% CI
By default, Minitab calculates the 100(1 - α)% CI for ρ as follows:
CI = [min(C, ρL), max(C, ρU)]
where:
- 100(1 - 2α)% CI
If you select the option to use the 100(1 - 2α)% CI, then the CI is given by the following:
CI = [ρL, ρU] - One-sided intervals
For a hypothesis of Test mean / reference mean > lower limit, the 100(1 - α)% lower bound is equal to ρL.
For a hypothesis of Test mean / reference mean < upper limit, the 100(1 - α)% upper bound is equal to ρU.
Notation
| Term | Description |
|---|---|
 | Mean of the test sample |
 | Mean of the reference sample |
| S12 | Sample covariance between the X values and the Y values |
| S1 | Standard deviation of the test sample |
| n | the sample size |
| S2 | Standard deviation of the reference sample |
| δ1 | Lower equivalence limit |
| δ2 | Upper equivalence limit |
| v | Degrees of freedom |
| α | Significance level for the test (alpha) |
| t1-α,v | Upper 1 - α critical value for a t-distribution with v degrees of freedom |
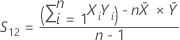
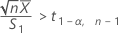
T-values
 , and let t2 be the t-value for the hypothesis,
  , where
  is the ratio of the mean of the test population to the mean of the
reference population.
is the ratio of the mean of the test population to the mean of the
reference population. 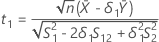
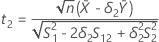
Notation
| Term | Description |
|---|---|
 | Mean of the test sample |
 | Mean of the reference sample |
| S1 | Standard deviation of the test sample |
| S2 | Standard deviation of the reference sample |
| S12 | Correlation between the X values and the Y values |
| n | Number of pairs of observations |
| δ1 | Lower equivalence limit |
| δ2 | Upper equivalence limit |
| Λ | Unknown ratio of the mean of the test population to the mean of the reference population |
P-values
If  , then:
| H0 | P-Value |
|---|---|
 |
 |
 |
 |
Notation
| Term | Description |
|---|---|
| Λ | Unknown ratio of the mean of the test population to the mean of the reference population |
| δ1 | Lower equivalence limit |
| δ2 | Upper equivalence limit |
| v | Degrees of freedom |
| T | t-distribution with v degrees of freedom |
| t1 | t-value for the hypothesis  |
| t2 | t-value for the hypothesis  |
Note
For information on how the t-values are calculated, see the section on t-values.