A quality engineer at a wooden handle company tests the strength of a random sample of broom handles. The engineer records the force that is required to break each handle. The engineer creates a graph of the data and notices that one of the values in the sample seems unusually small.
The engineer performs an outlier test to determine whether the smallest value is an outlier.
- Open the sample data, HandleStrength.MWX.
- Choose .
- In Variables, enter BreakStrength.
- Click Options.
- From What do you want to determine? (Alternative hypothesis), select Smallest data value is an outlier.
- Click OK in each dialog box.
Interpret the results
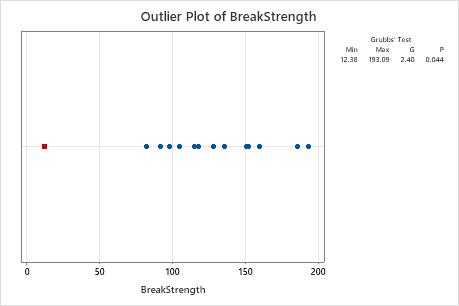
The mean of the sample is 123.4. The G statistic indicates that the smallest data value, 12.38, is 2.4 standard deviations less than the mean. The p-value indicates that, if all values are truly from the same, normally distributed population, then the probability of obtaining a minimum value that small is only 0.044. Because the p-value of 0.044 is less than the significance level (denoted as α or alpha) of 0.05, the engineer rejects the null hypothesis and concludes that the smallest value is an outlier.
The engineer investigates and discovers that the person who entered the data accidentally typed 12.38 instead of 123.8.
Method
| Null hypothesis | All data values come from the same normal population |
|---|---|
| Alternative hypothesis | Smallest data value is an outlier |
| Significance level | α = 0.05 |
Grubbs' Test
| Variable | N | Mean | StDev | Min | Max | G | P |
|---|---|---|---|---|---|---|---|
| BreakStrength | 14 | 123.4 | 46.3 | 12.4 | 193.1 | 2.40 | 0.044 |
Outlier
| Variable | Row | Outlier |
|---|---|---|
| BreakStrength | 10 | 12.38 |