In This Topic
Step 1: Determine whether the data do not follow a Poisson distribution
- P-value ≤ α: The data do not follow a Poisson distribution (Reject H0)
- If the p-value is less than or equal to the significance level, the decision is to reject the null hypothesis and conclude that your data do not follow a Poisson distribution.
- P-value > α: You cannot conclude that the data do not follow a Poisson distribution (Fail to reject H0)
- If the p-value is larger than the significance level, the decision is to fail to reject the null hypothesis because you do not have enough evidence to conclude that your data do not follow a Poisson distribution.
Method
| Frequencies in Observed |
|---|
Descriptive Statistics
| N | Mean |
|---|---|
| 300 | 0.536667 |
Observed and Expected Counts for Defects
| Defects | Poisson Probability | Observed Count | Expected Count | Contribution to Chi-Square |
|---|---|---|---|---|
| 0 | 0.584694 | 213 | 175.408 | 8.056 |
| 1 | 0.313786 | 41 | 94.136 | 29.993 |
| 2 | 0.084199 | 18 | 25.260 | 2.086 |
| >=3 | 0.017321 | 28 | 5.196 | 100.072 |
Chi-Square Test
| Null hypothesis | H₀: Data follow a Poisson distribution |
|---|---|
| Alternative hypothesis | H₁: Data do not follow a Poisson distribution |
| DF | Chi-Square | P-Value |
|---|---|---|
| 2 | 140.208 | 0.000 |
Key Result: P-Value
In these results, the null hypothesis states that the data follow a Poisson distribution. Because the p-value is 0.000, which is less than 0.05, the decision is to reject the null hypothesis. You can conclude that the data do not come from a Poisson distribution.
Step 2: Examine the difference between observed and expected values for each category
Use a bar chart of observed and expected values to determine whether, for each category, the number of observed values differs from the number of expected values. Larger differences between observed and expected values indicate that the data do not follow a Poisson distribution.
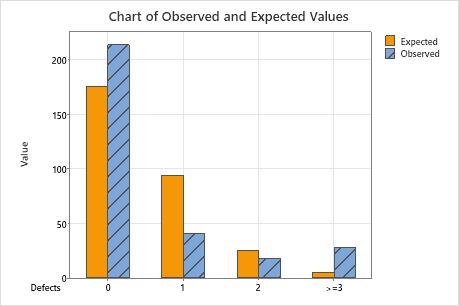
This bar chart indicates that the observed values for 0 defects, 1 defect, and more than 3 defects are different from the expected values. Thus, the bar chart visually confirms what the p-value indicates, which is that the data do not follow a Poisson distribution.