In This Topic
Fitted values
The predicted Y or  is the mean response value for the given predictor values using the estimated regression equation.
Cross-validated fitted values
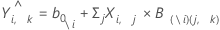
Notation
| Term | Description |
|---|---|
| \i | Indicates that i observation was left out of the model calculation |
| b0\i | the intercept for the model that does not include observation i |
| X | the predictor values |
| B(\i)(j, k) | the coefficients for the model that does not include observation i |
Residuals

Notation
| Term | Description |
|---|---|
| yi | ith observed response value |
 | ith fitted value for the response |
Cross-validated residuals
Cross-validated residuals measure the model's predictive ability and are used to calculate the PRESS statistic. Cross-validated residuals in PLS and least squares regression are conceptually similar, but their calculations differ.
Formula
In PLS, the cross-validated residuals are the differences between the actual responses and the cross-validated fitted values.

The cross-validated residual value varies based on how many observations are omitted each time the model is recalculated during cross-validation.
In least squares regression, the cross-validated residuals are calculated directly from the ordinary residuals.
Notation
| Term | Description |
|---|---|
| (i) | observation omitted from the model calculation |
| yi | response value |
 | cross-validated fitted value |
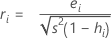
Standardized residual (Std Resid)
Standardized residuals are also called "internally Studentized residuals."
Formula
Notation
| Term | Description |
|---|---|
| ei | i th residual |
| hi | i th diagonal element of X(X'X)–1X' |
| s2 | mean square error |
| X | design matrix |
| X' | transpose of the design matrix |
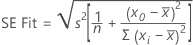
Standard error of fitted value (SE Fit)
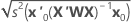
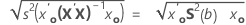
The standard error of the fitted value in a regression model with one predictor is:
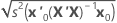
The standard error of the fitted value in a regression model with more than one predictor is:
For weighted regression, include the weight matrix in the equation:
When the data have a test data set or K-fold cross validation, the formulas are the same. The value of s2 is from the training data. The design matrix and the weight matrix are also from the training data.
Notation
| Term | Description |
|---|---|
| s2 | mean square error |
| n | number of observations |
| x0 | new value of the predictor |
 | mean of the predictor |
| xi | ith predictor value |
| x0 | vector of values that produce the fitted values, one for each column in the design matrix, beginning with a 1 for the constant term |
| x'0 | transpose of the new vector of predictor values |
| X | design matrix |
| W | weight matrix |
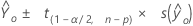
Confidence interval
The confidence interval is the range in which the estimated mean response for a given set of predictor values is expected to fall. The interval is defined by lower and upper limits, which Minitab calculates from the confidence level and the standard error of the fits.
Formula
Notation
| Term | Description |
|---|---|
| α | alpha value |
| n | number of observations |
| p | number of predictors |
 |  |
| s 2 | mean square error |
| S 2(b) | variance-covariance matrix of the coefficients |
Prediction interval
The prediction interval is the range in which the fitted response for a new observation is expected to fall.
Formula

Notation
| Term | Description |
|---|---|
| s(Pred) |  |
 | fitted response value for a given set of predictor values |
| α | level of significance |
| n | number of observations |
| p | number of model parameters |
| s 2 | mean square error |
| X | predictor matrix |
| X0 | vector of given predictor values with 1 column and p rows |
| X'0 | transpose of the new vector of predictor values with 1 row and p columns |