A materials engineer at a furniture manufacturing site wants to assess the stiffness of the particle board that the manufacturer uses. The engineer measures the stiffness and the density of a sample of particle board pieces.
The engineer uses simple regression to determine whether the density of the particles is associated with the stiffness of the board.
- Open the sample data, ParticleBoard.MWX.
- Choose .
- In Response (Y), enter Stiffness.
- In Predictor (X), enter Density.
- Under Type of Regression Model, select Quadratic.
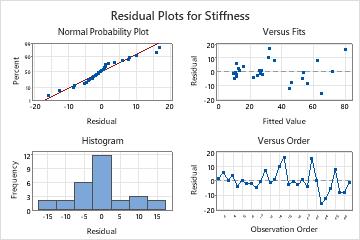
- Click Graphs. Under Residual Plots, select Four in one. Click OK.
- Click Options. Under Display Options, select Display confidence interval and Display prediction interval.
- Click OK in each dialog.
Interpret the results
In the Analysis of Variance table, the p-value for the regression model is 0.000, which means that the actual p-value is less than 0.0005. Because the p-value is less than the significance level of 0.05, the engineer can conclude that the association between stiffness and density is statistically significant. In the Sequential Analysis of Variance table, the p-value for the linear term, Density is 0.000 and for the quadratic term, Density2 is 0.003. Both values are less than the significance level of 0.05.
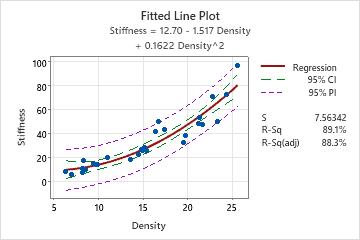
However, there appears to be an outlier in the top right corner of the fitted line plot. Because the outlier could have a strong effect on the results, the engineer should investigate this point to determine its cause.
Stiffness = 12.70 - 1.517 Density + 0.1622 Density^2
Model Summary
| S | R-sq | R-sq(adj) |
|---|---|---|
| 7.56342 | 89.13% | 88.29% |
Analysis of Variance
| Source | DF | SS | MS | F | P |
|---|---|---|---|---|---|
| Regression | 2 | 12189.4 | 6094.70 | 106.54 | 0.000 |
| Error | 26 | 1487.3 | 57.21 | ||
| Total | 28 | 13676.7 |
Sequential Analysis of Variance
| Source | DF | SS | F | P |
|---|---|---|---|---|
| Linear | 1 | 11552.8 | 146.86 | 0.000 |
| Quadratic | 1 | 636.6 | 11.13 | 0.003 |