A package engineer needs to ensure that the seals on plastic bags that hold a product are strong enough to prevent leaks, yet not so strong that the consumer cannot open the bags. The bags keep surgical instruments dry and sterile until someone opens the bags. The engineer wants to optimize the seal strength to between 20 and 32 lbs (lower and upper bounds) with a target of 26 lbs. The engineer also wants to minimize the variability of seal strength so that it is 1 or less. The engineer determines that hot bar temperature, dwell time, and hot bar pressure, are factors that affect the strength of the seal. The engineer also determines that hot bar temperature, dwell time, and material temperature are important factors that affect the variation. The engineer designs a central composite response surface experiment to examine the factors that impact the strength and variability of the seal. The engineer uses the natural log transformation to analyze the variability of the seal.
The engineer collects data and analyzes the design to determine which factors impact seal strength.
- Open the sample data, SealStrength.MWX.
- Choose .
- In Responses, enter Strength.
- Click Graphs.
- Under Residual Plots, select Four in one.
- Click OK in each dialog box.
Interpret the results
In the Analysis of Variance table, the p-values for the HotBarT*HotBarT, DwelTime*DwelTime, and HotBarT*DwelTime are significant. The engineer can consider reducing the model to remove the terms that are not significant. For more information, go to Model reduction.
The R2 value shows that the model explains 78.58% of the variance in strength, which indicates that the model fits the data adequately. The predicted R2 of 0 suggests that this model is overfit, which supports reducing the model.
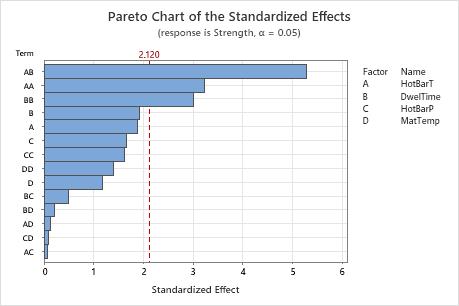
The Pareto plot of the effects allow you to visually identify the important effects and compare the relative magnitude of the various effects. In addition, you can see that the largest effect is HotBarT*DwelTime (AB) because it extends the farthest.
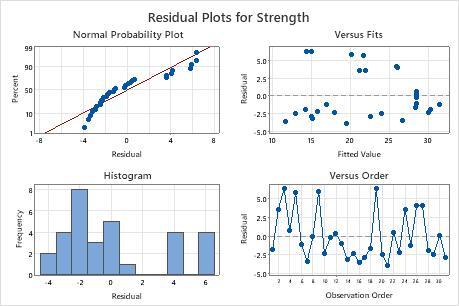
In the residuals plots, the points on the normal probability plot do not follow the straight line. Reducing the model may fix this.
Coded Coefficients
| Term | Coef | SE Coef | T-Value | P-Value | VIF |
|---|---|---|---|---|---|
| Constant | 28.44 | 1.66 | 17.09 | 0.000 | |
| HotBarT | 1.685 | 0.899 | 1.87 | 0.079 | 1.00 |
| DwelTime | -1.719 | 0.899 | -1.91 | 0.074 | 1.00 |
| HotBarP | 1.481 | 0.899 | 1.65 | 0.119 | 1.00 |
| MatTemp | 1.060 | 0.899 | 1.18 | 0.255 | 1.00 |
| HotBarT*HotBarT | -2.662 | 0.823 | -3.23 | 0.005 | 1.03 |
| DwelTime*DwelTime | -2.476 | 0.823 | -3.01 | 0.008 | 1.03 |
| HotBarP*HotBarP | -1.329 | 0.823 | -1.61 | 0.126 | 1.03 |
| MatTemp*MatTemp | -1.151 | 0.823 | -1.40 | 0.181 | 1.03 |
| HotBarT*DwelTime | -5.81 | 1.10 | -5.28 | 0.000 | 1.00 |
| HotBarT*HotBarP | -0.09 | 1.10 | -0.08 | 0.938 | 1.00 |
| HotBarT*MatTemp | -0.14 | 1.10 | -0.13 | 0.902 | 1.00 |
| DwelTime*HotBarP | 0.55 | 1.10 | 0.50 | 0.624 | 1.00 |
| DwelTime*MatTemp | 0.24 | 1.10 | 0.22 | 0.832 | 1.00 |
| HotBarP*MatTemp | -0.10 | 1.10 | -0.09 | 0.929 | 1.00 |
Model Summary
| S | R-sq | R-sq(adj) | R-sq(pred) |
|---|---|---|---|
| 4.40228 | 78.58% | 59.84% | 0.00% |
Analysis of Variance
| Source | DF | Adj SS | Adj MS | F-Value | P-Value |
|---|---|---|---|---|---|
| Model | 14 | 1137.51 | 81.251 | 4.19 | 0.004 |
| Linear | 4 | 218.65 | 54.662 | 2.82 | 0.060 |
| HotBarT | 1 | 68.13 | 68.129 | 3.52 | 0.079 |
| DwelTime | 1 | 70.94 | 70.939 | 3.66 | 0.074 |
| HotBarP | 1 | 52.62 | 52.616 | 2.71 | 0.119 |
| MatTemp | 1 | 26.96 | 26.963 | 1.39 | 0.255 |
| Square | 4 | 372.07 | 93.018 | 4.80 | 0.010 |
| HotBarT*HotBarT | 1 | 202.61 | 202.611 | 10.45 | 0.005 |
| DwelTime*DwelTime | 1 | 175.32 | 175.318 | 9.05 | 0.008 |
| HotBarP*HotBarP | 1 | 50.52 | 50.522 | 2.61 | 0.126 |
| MatTemp*MatTemp | 1 | 37.87 | 37.866 | 1.95 | 0.181 |
| 2-Way Interaction | 6 | 546.79 | 91.132 | 4.70 | 0.006 |
| HotBarT*DwelTime | 1 | 540.47 | 540.470 | 27.89 | 0.000 |
| HotBarT*HotBarP | 1 | 0.12 | 0.121 | 0.01 | 0.938 |
| HotBarT*MatTemp | 1 | 0.30 | 0.305 | 0.02 | 0.902 |
| DwelTime*HotBarP | 1 | 4.84 | 4.840 | 0.25 | 0.624 |
| DwelTime*MatTemp | 1 | 0.90 | 0.899 | 0.05 | 0.832 |
| HotBarP*MatTemp | 1 | 0.16 | 0.160 | 0.01 | 0.929 |
| Error | 16 | 310.08 | 19.380 | ||
| Lack-of-Fit | 10 | 308.20 | 30.820 | 98.51 | 0.000 |
| Pure Error | 6 | 1.88 | 0.313 | ||
| Total | 30 | 1447.60 |
Regression Equation in Uncoded Units
| Strength | = | -289.3 + 2.287 HotBarT + 206.6 DwelTime + 0.124 HotBarP + 0.594 MatTemp - 0.00426 HotBarT*HotBarT - 39.6 DwelTime*DwelTime - 0.000532 HotBarP*HotBarP - 0.00288 MatTemp*MatTemp - 0.930 HotBarT*DwelTime - 0.000070 HotBarT*HotBarP - 0.00028 HotBarT*MatTemp + 0.0440 DwelTime*HotBarP + 0.047 DwelTime*MatTemp - 0.00010 HotBarP*MatTemp |
|---|
Fits and Diagnostics for Unusual Observations
| Obs | Strength | Fit | Resid | Std Resid | |
|---|---|---|---|---|---|
| 3 | 20.69 | 14.43 | 6.26 | 2.20 | R |
| 5 | 27.43 | 21.72 | 5.71 | 2.01 | R |
| 9 | 25.99 | 20.16 | 5.83 | 2.05 | R |
| 19 | 21.38 | 15.10 | 6.28 | 2.21 | R |