What is a covariate?
Covariates are usually used in ANOVA and DOE. In these models, a covariate is any continuous variable, which is usually not controlled during data collection. Including covariates the model allows you to include and adjust for input variables that were measured but not randomized or controlled in the experiment. Including a covariate in the model can reduce the error in the model to increase the power of the factor tests.
For example, an engineer wants to study the level of corrosion on four types of iron beams. The engineer exposes each beam to a liquid treatment to accelerate corrosion, but cannot control the temperature of the liquid. Temperature is a covariate that should be considered in the model.
In a DOE, an engineer may be interested in the effect of the covariate ambient temperature on the drying time of two different types of paint.
Example of adding a covariate to a general linear model
A textile company uses three different machines to manufacture monofilament fibers. They want to determine whether the breaking strength of the fiber differs based on which machine is used. They collect data on the strength and diameter for 5 randomly selected fibers from each machine. Because fiber strength is related to its diameter, they also record the fiber diameter for use as a possible covariate.
| C1 | C2 | C3 |
|---|---|---|
| Machine | Diameter | Strength |
| 1 | 20 | 36 |
| 1 | 25 | 41 |
| 1 | 24 | 39 |
| 1 | 25 | 42 |
| 1 | 32 | 49 |
| 2 | 22 | 40 |
| 2 | 28 | 48 |
| 2 | 22 | 39 |
| 2 | 30 | 45 |
| 2 | 28 | 44 |
| 3 | 21 | 35 |
| 3 | 23 | 37 |
| 3 | 26 | 42 |
| 3 | 21 | 34 |
| 3 | 15 | 32 |
- Verify that the covariate and response are linearly related. You can do this in Minitab by analyzing the data with a fitted line plot.
- Choose .
- In Response (Y) (Y) enter Strength.
- In Predictor (X) (X) enter Diameter.
- Assess how closely the data fall beside the fitted line and how close R2 is to a "perfect fit" (100%).
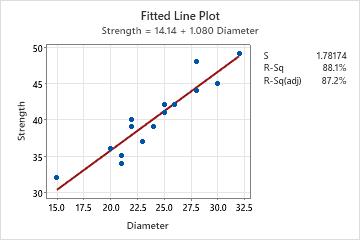
The fitted line plot indicates a strong linear relationship (87.2%) between diameter and strength.
- Perform the GLM analysis with the covariate.
- Choose .
- In Responses, enter Strength.
- In Factors, enter Machine.
- In Covariates, enter Diameter.
- Click OK.
For the fiber production data, Minitab displays the following results:
General Linear Model: Strength versus Diameter, Machine
Analysis of Variance Source DF Adj SS Adj MS F-Value P-Value Diameter 1 178.014 178.014 69.97 0.000 Machine 2 13.284 6.642 2.61 0.118 Error 11 27.986 2.544 Lack-of-Fit 7 18.486 2.641 1.11 0.487 Pure Error 4 9.500 2.375 Total 14 346.400The F-statistic for machines is 2.61 and the p-value is 0.118. Because the p-value >0.05, you fail to reject the null hypothesis that the fiber strengths do not differ based on the machine used at the 5% significance level. You can assume the fiber strengths are the same on all the machines. Notice that the F-statistic for diameter (covariate) is 69.97 with a p-value of 0.000. This indicates that the covariate effect is significant. That is, diameter has a statistically significant impact on the fiber strength.
Now, suppose you rerun the analysis and omit the covariate. This will result in the following output:
General Linear Model: Strength versus Machine
Analysis of Variance Source DF Adj SS Adj MS F-Value P-Value Machine 2 140.4 70.20 4.09 0.044 Error 12 206.0 17.17 Total 14 346.4Notice that the F-statistic is 4.09 with a p-value of 0.044. Without the covariate in the model, you reject the null hypothesis at the 5% significance level and conclude the fiber strengths do differ based on which machine is used.
This conclusion is completely opposite the conclusion you got when you performed the analysis with the covariate. This example shows how the failure to include a covariate can produce misleading analysis results.