An inspector for a clothing manufacturer investigates sources of clothing defects to prioritize improvement projects. The inspector tracks the number and type of defects in the process.
An engineer creates a weighted Pareto chart to prioritize the sources that the inspector found based on total cost, not frequency, of the defects. A weighted Pareto chart may not point to the same errors or problems that a Pareto chart based on frequency does. For more information on weighted Pareto charts, go to Pareto chart basics.
- Open the sample data, ClothingDefect.MWX.
- Choose .
- In Defects or attribute data in, enter Defect.
- In Frequencies in, enter Count*Cost.
- Select Combine remaining defects into one category after this percent, and enter 95.
- Click OK.
Interpret the results
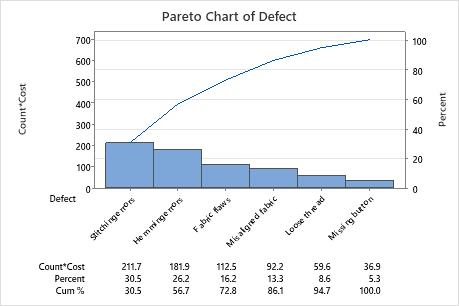
In this example, the weighted Pareto chart uses the same clothing data as in the Example of Pareto Chart, except that the defects are weighted by their cost. To calculate the weighted values, the cost of each defect type is multiplied by the number of defects for that type.
The weighted Pareto chart shows that stitching errors, which account for 23.3% of the total number of defects in the unweighted Pareto chart, account for 30.5% of the total defect costs. Missing buttons, which account for 45.2% of the defects in the unweighted Pareto chart, account for only 5.3% of the total defect costs. However, hemming errors, which account for only 9% of the defects in the unweighted Pareto chart, are the second most costly defect.