In This Topic
Gage R&R expanded study methods
Minitab uses the general linear model approach with three types of ANOVA models to perform Gage R&R studies: the random-effects model, the mixed-effects model, and the nested designs model. The random-effects model is the default. The mixed-effects or the nested design model is used if any factors are fixed or nested.
The final selected model only includes the main effects terms, the significant highest order interactions, and the relevant interactions in between. Minitab calculates the ANOVA table for the appropriate model. That table is then used to calculate the variance components, which appear in the Gage R&R tables.
References
Burdick, R. K., Borror, C. M., and Montgomery, D.C. (2003). "A Review of Methods for Measurement Systems Capability Analysis", Journal of Quality Technology, 35(4) 342–354.
Adamec, E. and Burdick, R.K. (2003). "Confidence Intervals for a Discrimination Ratio in a Gauge R&R Study with Three Random Factors", Quality Engineering, 15(3) 383–389.
Random effects model
The default model used in this command is the random-effect model. If you specify a full model for the three factors, then:
Yijkl = μ + Pi + Oj + Ak + (PO)ij + (PA)jk + (OA)jk + (POA)ijk + εijkl
| Term | Description |
|---|---|
| μ | constant |
| Pi | the ith part |
| Term | Description |
|---|---|
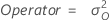
| Oj | the jth operator |
| Term | Description |
|---|---|
| Ak | the kth level of the additional factor |
Pi, Oj
, Ak, (PO)ij, (PA)jk,
(OA)jk, (POA)ijk, and εijkl are independently
normally distributed with mean of zero and, respectively, variances of
 .
.
Minitab uses Fit General Linear Model to estimate the variance components. For more details about estimating variance components, go to Methods and Formulas for Fit General Linear Model.
- Total Gage R&R
-

- Repeatability
-
- Reproducibility
-

- Operator
-
- A
-

- Part * Operator
-

- Part * A
-

- Part-to-Part
-
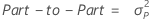
- Part
-

- Total variation
-

Note
When you specify to the historical standard deviation to estimate the process variation, Minitab does the following:
- If the historical standard
deviation is greater than the total gage standard deviation calculated from the
data, then the total standard deviation is σ and the part-to-part standard
deviation is
 .
.
- Otherwise Minitab uses the data to estimate the total standard deviation and the part-to-part variation.
- Total Gage R&R
-

- Repeatability
-

- Reproducibility
-

- Operator
-

- Part * Operator
-

- Part-to-Part
-

- Part
-

- A
-

- Part * A
-

- Total variation
-

Note
When you specify to the historical standard deviation to estimate the process variation, Minitab does the following:
- If the historical standard
deviation is greater than the total gage standard deviation calculated from the
data, then the total standard deviation is σ and the part-to-part standard
deviation is
 .
.
- Otherwise Minitab uses the data to estimate the total standard deviation and the part-to-part variation.
- Gage Repeatability = the variance component for the error term
- Part-to-Part variation = Variance component for Part or the Sum of the Variance components for the Part-to-Part terms
- Gage reproducibility = the Sum of the Variance components for the rest of the terms
Mixed-effects model
If some terms in the linear model are fixed, it is a mixed effect model. The variance components for the random terms are obtained using the results from Fit General Linear Model.
For more details about estimating variance components, go to Methods and Formulas for Fit General Linear Model.
- By fitting the linear model, Minitab estimates the coefficients for the first J-1 levels of the factor.
- The coefficient for level J = –(Sum of coefficients across the first J-1 levels).
- Estimated variability = Sum of (coefficient)2 across all levels / number of levels.
In the calculation of the Gage reproducibility for mixed effects, the variance components for the fixed terms will be replaced by φ, but the random effects model definitions hold.
Nested design model
If some factors are nested under other factors, Minitab fits the model using Fit General Linear Model. For more details about estimating variance components, go to Methods and Formulas for Fit General Linear Model.
Gage repeatability, reproducibility, and part-to-part variation are defined the same way as in the random and the fixed factor cases.
Gage R&R expanded calculations
Minitab displays two tables for Expanded Gage R&R Study. The first table contains the VarComp column and the %Contribution (of VarComp) column. For more details about estimating variance components, go to Methods and Formulas for Fit General Linear Model.
%Contribution = value of VarComp / Total Variation.
- StdDev (SD) = sqrt (VarComp)
- Study Var = number of standard deviation * StdDev
- %Study Var (%SV) = Study Var / Study Var for Total Variation
- %Tolerance = Study Var / Process Tolerance
- %Process = StdDev / historical standard deviation
%Tolerance and CI
%Tolerance is the percent of tolerance for each component.
If the tolerance (Upper spec – Lower spec) is given, the %tolerance is calculated by dividing the Study Var for each component by the specified tolerance.
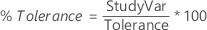
If only one specification limit is given, the percent tolerance is half the Study Var for each component divided by the one-sided tolerance. The one-sided tolerance is the absolute value of the given specification limit subtracted from the average of all the measurements.
Minitab displays this value only when you enter a process tolerance (Upper spec – Lower spec) or a specification limit in the Options subdialog box.
If L and U are the lower and upper bounds of a variance component, then the confidence interval for the corresponding percent tolerance is:
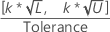
| Term | Description |
|---|---|
| k | k is the study constant and the default value is 6 |
Number of distinct categories
The number of distinct categories represents the number of non-overlapping confidence intervals that will span the range of product variation. You can also think of it as the number of groups within your process data that your measurement system can discern.

Minitab then truncates this value, except when the value is less than 1. In that case, Minitab sets the number of distinct categories equal to 1.
Confidence interval
Suppose L and U are the lower and upper bounds of the ratio of the gage variance and the total variance, then the lower and the upper bounds for the number of distinct categories are:


Note
L and U must be in (0, 1). If L and U are outside the range, the lower and upper bounds for the number of distinct categories are missing.
Probabilities of misclassification
Minitab calculates the probabilities of misclassifications as both joint probabilities and conditional probabilities when you enter at least one specification limit. For analyses that offer the ANOVA method and the Xbar-R method, the results include the probabilities of misclassification when you use the ANOVA method.
Joint probabilities
Probability that part is bad and you accept it:

Probability that part is good and you reject it:

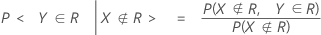
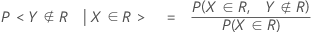
Conditional probabilities
Probability that given a part is bad, you accept it (false accept):
Probability that given a part is good, you reject it (false reject):
Notation


F(X,Y) is the cumulative distribution function (CDF) of the bivariate normal random vector (X,Y)T with:
mean, μ = (θ,θ)T

F(X) and F(Y) are the corresponding marginal CDFs.
That is,