What are stages?
Use stages to create a historical control chart that shows how a process changes over specific periods of time. By default, Minitab recalculates the center line and control limits for each stage. For more information, go to Add stages to show how a process changed.
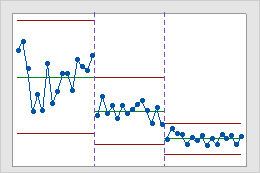
This historical control chart shows three stages of a process, which represent before, during, and after the implementation of a new procedure.
Start a new stage with each new value from a column
- In Define stages (historical groups) with this variable, enter the column that identifies the stages. In the example below, the values in the Stage column change from 1 to 2 to indicate the beginning of stage 2. The values change from 2 to 3 to indicate the beginning of stage 3.
- Under When to start a new stage, select With each new value.
| C1 | C2 | C3 |
|---|---|---|
| Variable_1 | Variable_2 | Stage |
| ... | ... | ... |
| 9 | 20 | 1 |
| 10 | 22 | 1 |
| 8 | 21 | 2 |
| 11 | 23 | 2 |
| ... | ... | ... |
| 7 | 20 | 2 |
| 8 | 21 | 2 |
| 5 | 17 | 3 |
| 7 | 19 | 3 |
| ... | ... | ... |
Note
Ellipses indicate additional rows of data that are not shown.
Start a new stage with the occurrence of specific values in a column
- In Define stages (historical groups) with this variable, enter the column that identifies the stages. In the example below, the Date column contains the date that each row of data was collected. New stages began on November 9 and December 11.
- Under When to start a new stage, select With the first occurrence of these values and enter the values. Enclose date/time or text values in double quotation marks. In this example, the values to enter are "11/9" "12/11".
| C1 | C2 | C2-D |
|---|---|---|
| Variable_1 | Variable_2 | Date |
| ... | ... | ... |
| 9 | 20 | 11/8 |
| 10 | 22 | 11/8 |
| 8 | 21 | 11/9 |
| 11 | 23 | 11/9 |
| ... | ... | ... |
| 7 | 20 | 12/10 |
| 8 | 21 | 12/10 |
| 5 | 17 | 12/11 |
| 7 | 19 | 12/11 |
| ... | ... | ... |
Note
Ellipses indicate additional rows of data that are not shown.