In Graph variables, enter 2 to 20 columns of numeric or date/time data with the same number of rows. Minitab displays a scatterplot for each combination of variables.
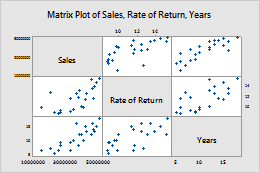
In this worksheet, Rate of Return, Sales and Years are the graph variables. The graph shows the relationships between each possible combination of graph variables.
| C1 | C2 | C3 |
|---|---|---|
| Rate of Return | Sales | Years |
| 15.4 | 50400200 | 18 |
| 11.3 | 42100650 | 15 |
| 9.9 | 39440420 | 12 |
| ... | ... | ... |