Complete the following steps to specify the data for your graph.
- In Graph variables, enter multiple columns of numeric or date/time data that you want to graph.
- In Categorical variables for grouping (1-3, outermost first), enter up to three columns of categorical data that define groups. The first variable is the outermost on the scale and the last variable is the innermost.
- Under Scale Level for Graph Variables, select one of the following:
- Graph variables displayed outermost on scale: Graph variables are the outermost groups and the categorical variables are the innermost groups. On the graph below, graph variables are outermost on the scale.
- Graph variables displayed innermost on scale: Graph variables are the innermost groups and the categorical variables are the outermost groups.
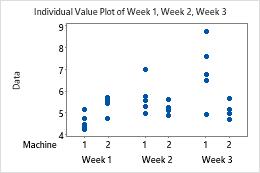
This worksheet contains the diameters of pipes that were produced each week for three weeks, and the machines that manufactured them. Week 1, Week 2, and Week 3 are the graph variables. Machine is the categorical variable for grouping. The graph shows the diameters of individual pipes produced by each machine, clustered by week.
| C1 | C2 | C3 | C4 |
|---|---|---|---|
| Week 1 | Week 2 | Week 3 | Machine |
| 5.19 | 5.57 | 8.73 | 1 |
| 5.53 | 5.11 | 5.01 | 2 |
| 4.78 | 5.76 | 7.59 | 1 |
| ... | ... | ... | ... |