A quality control engineer needs to ensure that the caps on shampoo bottles are fastened correctly. If the caps are fastened too loosely, they may fall off during shipping. If they are fastened too tightly, they may be too difficult to remove. The target torque value for fastening the caps is 18. The engineer collects a random sample of 68 bottles and tests the amount of torque that is needed to remove the caps.
As part of the initial investigation, the engineer creates a histogram of the torque to evaluate the distribution of the data.
- Open the sample data, CapTorque.MWX.
- Choose .
- In Graph variables, enter Torque.
- Click OK.
Interpret the results
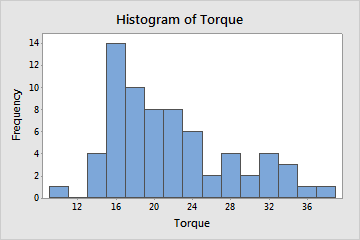
Most caps were fastened with a torque of 14 to 24. Only one cap was very loose, with a torque of less than 11. However, the distribution is positively skewed. Many caps required a torque of greater than 24 to remove, and five caps required a torque of greater than 33, nearly two times the target value.