Gridlines provide a background grid at major and minor tick mark
positions.
About gridlines
Gridlines provide points of reference on your graph. They are displayed by default on probability plots.
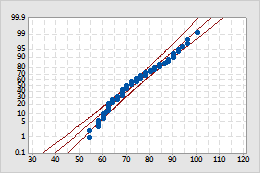
Probability plot
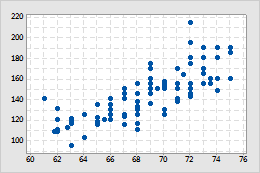
Scatterplot
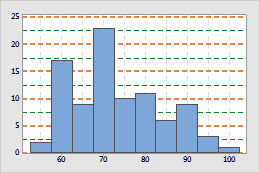
Histogram
Add gridlines when you create a graph
You can add gridlines when you create a graph that has a scale.
- In the dialog box for the graph you are creating, click Scale.
- Click the Gridlines tab.
- Under Show Gridlines For, choose the location for gridlines. If you choose a minor tick mark position, the gridlines for the major tick mark position are also included.
Add gridlines to an existing graph
You can add gridlines to any graph that has a scale.
- Double-click the graph.
- Right-click the graph and choose .
- Under Show Gridlines For, choose the location for gridlines. If you choose a minor tick mark position, the gridlines for the major tick mark position are also included.
Edit gridlines
After you add gridlines to a graph, you can edit them.
- Double-click the graph.
- Double-click a gridline.
-
Select the tab to make the edits that you want.
- Attributes: Change the color, size, and type of line.
- Show: Show or hide major or minor ticks.