Download the Macro
Be sure that Minitab knows where to find your downloaded macro. Choose . Under Macro location and browse to the location where you save macro files.
Important
If you use an older web browser, when you click the Download button, the file may open in Quicktime, which shares the .mac file extension with Minitab macros. To save the macro, right-click the Download button and choose Save target as.
Required Inputs
- A column of response data
- Corresponding columns containing the uncoded levels of the factors
Optional Inputs
- STORE C-C
- Stores the path of steepest ascent/descent in the worksheet. The inputs indicate the columns in the worksheet where the path will be stored. Specify one storage column for each factor. If this subcommand is not specified, Minitab displays the path, but does not store the path in the worksheet.
- STEP K
- Defines the step size, or increment, of the process variable (
 ) in coded units. By default, the increment is 1.
- BASE C
- Defines the step size in the path of steepest ascent/descent. The input b is the column with the coefficient that defines the step size. By default, the step size is the factor coefficient having the largest absolute value.
- DESCENT
- Specify to calculates the path of steepest descent instead of the (default) steepest ascent.
- RUNS K
- Indicates the number of runs to generate. The input, r, is a constant. By default, the number of runs is 5.
Running the Macro
Suppose you have a two factor design and the factors are stored in c5 and C6, the responses are in C7. You want to find a path that potentially maximizes your response. In addition, you want to store this path in the worksheet in columns C9-C10; the step size between runs should be of 2 (in coded units) and the factor contained in C5 will be the base factor. Finally, you would like to compute eight runs along the path of steepest ascent.
%ASCENT C7 C5-C6;
STORE C9-C10;
STEP 2;
BASE C5;
RUNS 8.
Click Run.
More Information
Overview of Response Surface Methods
Response Surface Methods (RSM) let you optimize a response of interest by
determining the best settings for the controllable factors. Thus, the basic
goal in RSM is to locate the optimal settings  .
.
You can use sequential experimentation to do this. Typically, start with a factorial or fractional factorial design to screen out irrelevant factors. After you have a regression model for the response, extrapolate and experiment along the path of steepest ascent to maximize the response. Finally, select a response surface design to model curvature and locate the optimum response.
The three basic steps of RSM are listed below:
- Factor screening experiments.
- Follow the path of steepest ascent/descent.
- Fit a quadratic regression model and optimize it.
The following sections describe the path of steepest ascent, explain how it is calculated, and provide a Minitab macro for performing this task, illustrated with two examples.
What is the Path of Steepest Ascent/Descent?
After you perform a screening experiment and obtain a linear model of the response (with only main effects), you want to move in a direction that quickly improves the response. To maximize the response, follow the path of steepest ascent. To minimize the response, follow the path of steepest descent.
Calculating the Path of Steepest Ascent/Descent
To calculate the path of steepest ascent, you need to first fit a model. Suppose an experiment has two factors and the interaction between factor x1 and x2 is not significant. The model equation for this experiment is:
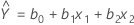
where  is the intercept estimate and
  ,
,
 are the coefficients for factors
  and
and  ,
respectively.
,
respectively.
After obtaining the model equation:
- Choose one process variable
as the "base factor" and identify the step size or increment (
 )
i for the base factor.
)
i for the base factor.
Note
By default, if the base factor is not specified, the macro will select the variable that has the largest absolute regression coefficient,
 .
.
- Determine the increment in
the other process variables using the following equation:

- Transform the increments from coded units to uncoded units.
Example 1: Maximizing Etch Rate
The following example is customized from one found in Response Surface Methodology: Process and Product Optimization Using Designed Experiments by Myers and Montgomery.
In semiconductor manufacturing, the goal is to maximize the plasma etch rate (the response) by varying levels of the factors anode-cathode gap (Gap) and power to the cathode (Power). Suppose running the experiment yields the following model:
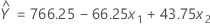
With  representing Gap and
  representing Power.
To calculate the path of steepest ascent using the macro, first identify
the columns in the worksheet that correspond to the response and to the main
effects ( and
and  )
in uncoded units. For this example, the response (Etch rate) is in C7 while the
main effects (Gap and Power) are in C5 and C6.
)
in uncoded units. For this example, the response (Etch rate) is in C7 while the
main effects (Gap and Power) are in C5 and C6.
To run the macro, go to and type:
%ASCENT C7 C5-C6;
 STORE C9-C10.
Note
If you are using the ASCENT17.mac version of the macro, type %ASCENT17 instead of %ASCENT.
Click Submit Commands.
Using the data from the worksheet, Minitab creates five runs in the path of steepest ascent and stores the path in columns C9 and C10. When the final model has only two factors, you can create a scatterplot to display the path of steepest ascent/descent.
Example 2: Minimizing Reaction Yield
This example is customized from one created by Myers and Montgomery to use the path of steepest descent instead of the path of steepest ascent.
Suppose the goal of an experiment is to minimize the reaction yield by finding better settings for four controllable factors: A (amount of reactant A), B (reaction time), C (amount of reactant C) and D (temperature). The uncoded (natural) levels for the four factors are: 10, 15 grams for factor A; 1, 2 minutes for factor B; 25, 35 grams for factor C; and 75, 85 °C for factor D. In addition, the base coefficient corresponds with reactant A and the step size is 1 gram in uncoded units. The fitted model is

To calculate the path of steepest descent using the macro, use the subcommand DESCENT. Because the column corresponding to reactant A is C5, the input for BASE is C5. The STEP in coded units is 1/2.5 = 0.4, because one coded unit of factor A is equivalent to 2.5 grams. To run the macro, go to and type:
%ASCENT C9 C5-C8;
STORE C11-C14;
STEP 0.4;
BASE C5;
DESCENT;
RUNS 10.
Note
If you are using the ASCENT17.mac version of the macro, type %ASCENT17 instead of %ASCENT.
Note
To obtain the output for the original textbook example, use the path of steepest ascent to calculate the improving direction. Submit the block of commands without the DESCENT subcommand, as shown below:
%ASCENT C9 C5-C8;
STORE C11-C14;
STEP 0.4;
BASE C5;
RUNS 10.
Reference
R. Myers and D. Montgomery (2002). Response Surface Methodology - Process and Product Optimization Using Designed Experiments, Second Edition. John Wiley & Sons, Inc.