Select the method or formula of your choice.
In This Topic
Pearson's r
Pearson's correlation is a measure of linear relationship between two variables, which ranges from +1 to -1. A correlation of +1 indicates a perfect positive linear relationship between variables.
The data are converted to ordinal data by taking the data values and coding as equally-spaced integers. For example, the series 4, 7, 20, is analyzed as 1, 2, 3, and thus, the series 4, 7, 7, 20, is analyzed as 1, 2, 2, 3.
Note
This is different from the Spearman statistic which analyzes the same sequence of 4, 7, 7, 20 as 1, 2.5, 2.5, 3.
Formula
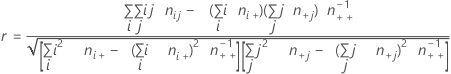
Notation
| Term | Description |
|---|---|
| ni+ | number of observations in the ith row |
| n+j | number of observations in the jth column |
| nij | observations in the cell corresponding to the ith row and jth column |
| n++ | total number of observations |
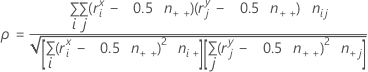
Spearman's rho
Spearman's rho is a measure of the linear relationship between two variables. Spearman's differs from Pearson's correlation only because the computations are done after the numbers are converted to ranks.
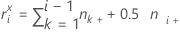
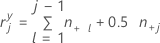
Formula
If i = 1, then:

If i = 2, 3,..., r, then:
If j = 1, then:

If j = 2, 3,..., c, then:
Notation
| Term | Description |
|---|---|
| c | number of columns |
| r | number of rows |
| ni+ | number of observations in the ith row |
| n+j | number of observations in the jth column |
| nij | observations in the cell corresponding to the ith row and jth column |
| n++ | total number of observations |