An engineer wants to assess the linearity and bias of a measurement gage that is used to measure inner diameters of bearings. The engineer chooses five parts that represent the expected range of measurements. Each part was measured by layout inspection to determine its master measurement, and then one operator randomly measured each part 12 times. The engineer performed a crossed gage R&R study previously, using the ANOVA method, and determined that the total study variation is 16.5368.
- Open the sample data, BearingDiameter.MWX.
- Choose .
- In Part numbers, enter Part.
- In Reference values, enter Master.
- In Measurement data, enter Response.
- In Process variation, enter 16.5368.
- Click OK.
Interpret the results
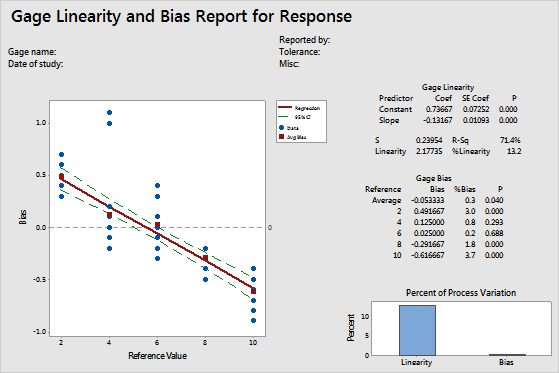
%Linearity (absolute value of the slope * 100) is 13.2, which indicates that the gage linearity explains 13% of the overall process variation. The p-value for the slope is 0.000, which indicates that the slope is significant and that linearity is present in the measurement system.
Because linearity is significant, the engineer must use the individual bias values and not the average overall bias value. The individual bias values vary from 0.2 to 3.7, and their p-values vary from 0.000 to 0.688. Reference values 2, 8, and 10 have bias. Values 4 and 6 do not have bias.