Select the method or formula of your choice.
In This Topic
Plotted points
Data in subgroups
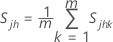
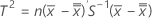
When data are in subgroups, T2 is calculated as follows:

where:

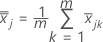
 is the mean vector of
  (mean of xjk values), which is calculated as follows:
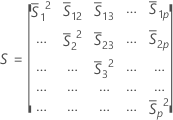
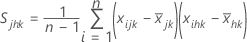
S = sample covariance matrix
The sample covariance matrix, S, is calculated as follows:
where:
where:
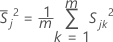
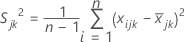
 , the sample variance for the jth characteristic in the kth sample, is calculated as follows:
where:
where:
 , the covariance, =
The average of the S matrices is an unbiased estimate of the variance when the process is in control. n must be greater than p and there must be no strong correlations between the variables so that the sample covariance matrix is not singular.
When the data are in subgroups, the chart displays a missing value for any subgroup that is an individual observation.
Individual observations
When data are individual observations, T2 is calculated as follows:
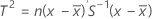
where:
where:

Notation
| Term | Description |
|---|---|
| n | sample size |
 | sample mean vector |
| xijk | the ith observation on the jth characteristic in the kth sample |
| m | number of samples |
Example of calculating T2
Minitab plots the T2 statistic on a control chart. If a plotted point exceeds the control limits, the process is out of control at that point. See the table and sample equations for reference on Minitab calculations.
The following data come from a cleaning solution development process. The amounts of sodium citrate and glycerine affect the potency of the solution.
| Subgroup Means | Variances and Covariances | T2 Statistic | ||||
| Subgroup | Sodium citrate (X1) | Glycerin (X2) | S 1 2 | S2 2 | S 1 2 k | T2 |
| 1 | 125 | 025 | 7292 | 8692 | 5791 | 5708 |
| 2 | 625 | 4 | 2292 | 2333 | 3333 | 1429 |
| 3 | 4 | 875 | 1467 | 0625 | 8000 | 9528 |
| 4 | 2 | 2 | 2933 | 7600 | 6667 | 8073 |
| 5 | 25 | 225 | 2500 | 2692 | 7917 | 7548 |
| 6 | 4 | 45 | 6667 | 9567 | 3333 | 2711 |
| 7 | 275 | 025 | 3692 | 4692 | 7108 | 7785 |
| 8 | 6 | 65 | 4333 | 7700 | 6933 | 6183 |
| 9 | 625 | 325 | 7892 | 5558 | 1325 | 3592 |
| 10 | 3 | 5 | 2867 | 9467 | 2600 | 4942 |
| 11 | 25 | 5 | 1767 | 1200 | 9000 | 3279 |
| 12 | 1 | 625 | 1467 | 1692 | 4033 | 0277 |
| Averages | 7875 | 2333 | 7931 | 9318 | 3003 | |
- Calculate the subgroup means for each variable, X1 and X2. In this case, each subgroup had four samples.
- If you have individual observations, Minitab uses them instead of the subgroup means in all calculations.
- Calculate the subgroup variances, S1 2 and S2 2.
- Calculate the subgroup covariances, S1 2 k.
- Calculate the means of the subgroup means, the means of subgroup variances, and the mean of the covariances.
- Designate the sample covariance matrix S and the mean vector.
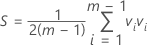
- Calculate T2, which is given by:
Minitab plots T2 on the T2 chart and compares it to the control limits to determine if individual points are out of control.
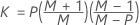
Center line
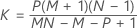
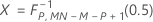
The center line for the T2 chart is KX. The calculation of K and X depends on the maximum sample size and whether Minitab estimates the covariance matrix from the data.
Data in subgroups
When data are in subgroups, KX is calculated as follows:
- Given covariance matrix
-

- Estimated covariance matrix
-
Individual observations
When data are individual observations, KX is calculated as follows:
- Given covariance matrix
-
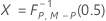
- Estimated covariance matrix
-

where:
Notation
| Term | Description |
|---|---|
| P | number of variables |
| M | number of subgroups |
| N | sample size |
 | the inverse cumulative F distribution with u numerator degrees of freedom and v denominator degrees of freedom |
 | the inverse cumulative beta distribution with first shape parameter α and second shape parameter β |
Control limit
Data in subgroups
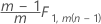
The upper control limit if you do not specify parameters is:
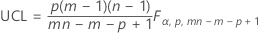
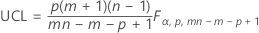
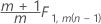
The upper control limit if you specify parameters is:
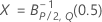
Individual observations
The upper control limit if you do not specify parameters is:
where:

See Woodall et al.1 for more information.
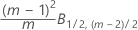
The upper control limit if you specify parameters is:

Notation
| Term | Description |
|---|---|
| α | fixed value of 0.00134989803156746 |
| p | number of characteristics |
| m |
For data in subgroups, if you do not specify parameter estimates, then m is the number of samples. If you do provide parameter estimates, then m is the number of samples used to create the covariance matrix. For individuals data, m is the number of observations. |
| n | size of each sample |
| F | indicates that the F distribution is used |
| B | indicates that the beta distribution is used |
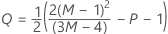
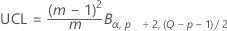
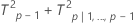
Decomposed T2 statistic
Decomposed T2 statistic:
where:

where:
xi(p − 1)is the decomposed mean vector
Sxx is the (p – 1) × (p – 1) principal submatrix of S
T2p|1,..., p−1 is an approximation that differs for phases and whether you have subgroups or individual observations:
Phase 1 for data in subgroups:
Phase 2 for data in subgroups:
Phase 1 for individual observations:
Phase 2 for individual observations:

Minitab calculates phase 1 control limits when you don't specify parameter estimates and phase 2 control limits when you do.
See Mason et al.2 for more information on the Decomposed T2 statistic.
Notation
| Term | Description |
|---|---|
| m | number of samples |
| F | indicates that the F distribution is used |
| B | indicates that the beta distribution is used |
Methods and formulas for Box-Cox
Box-Cox formula
If you use a Box-Cox transformation, Minitab transforms the original data values (Yi) according to the following formula:
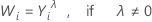
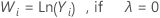
where λ is the parameter for the transformation. Minitab then creates a control chart of the transformed data values (Wi). To learn how Minitab chooses the optimal value for λ, go to Methods and formulas for Box-Cox Transformation.
Common λ values
| λ | Transformation |
|---|---|
| 2 |  |
| 0.5 |  |
| 0 |  |
| −0.5 |  |
| −1 |  |