A representative from a sales department purchases pens from a vendor to give away at trade shows. Each shipment of pens has a lot size of 5000 pens. The sales representative has a sampling plan to inspect 52 pens from each lot. If the number of defective pens is 2 or less, the sales representative accepts the entire shipment. Assume that the AQL is 1.5% and the RQL is 10%.
The sales manager wants to evaluate the risk associated with reducing the number of pens in the sample to 25 pens and reducing the acceptance number to 1.
- Choose .
- From the drop-down list, select Compare User Defined Sampling Plans.
- In Measurement type, select Go / no go (defective).
- In Units for quality levels, select Percent defective.
- In Acceptable quality level (AQL), enter 1.5.
- In Rejectable quality level (RQL or LTPD), enter 10.
- In Sample sizes, enter 52 25.
- In Acceptance numbers, enter 2 1.
- In Lot size, enter 5000.
- Click OK.
Interpret the results
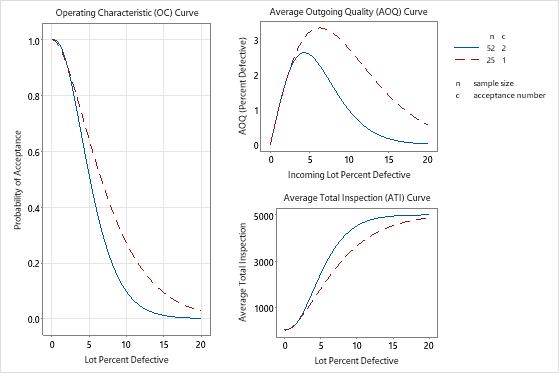
The manager compares the graphs from the different sampling plans and realizes that the two sample plans are fairly similar when the incoming quality is near 1.5% defective, but are fairly different when the incoming quality is near 10% defective.
At the AQL (1.5%), the probability of acceptance changes by a very small amount (0.957 – 0.946), and the AOQ and the ATI differences are also minimal. At the RQL (10%), the probability of acceptance changes by a much larger amount (0.271 – 0.097), and the AOQ and the ATI differences are also much larger.
The manager decides that it is easy and inexpensive to sample pens, and does not want to risk the overall poorer average outgoing quality or the overall higher number of pens sampled, due to rectifying inspection, when the incoming quality is poor.
Method
| Acceptable Quality Level (AQL) | 1.5 |
|---|---|
| Rejectable Quality Level (RQL or LTPD) | 10 |
Compare User Defined Plan(s)
| Sample Size(n) | Acceptance Number(c) | Percent Defective | Probability Accepting | Probability Rejecting | AOQ | ATI |
|---|---|---|---|---|---|---|
| 52 | 2 | 1.5 | 0.957 | 0.043 | 1.420 | 266.2 |
| 52 | 2 | 10.0 | 0.097 | 0.903 | 0.956 | 4521.9 |
| 25 | 1 | 1.5 | 0.946 | 0.054 | 1.412 | 292.4 |
| 25 | 1 | 10.0 | 0.271 | 0.729 | 2.698 | 3650.8 |
Average Outgoing Quality Limit(s) (AOQL)
| Sample Size(n) | Acceptance Number(c) | AOQL | At Percent Defective |
|---|---|---|---|
| 52 | 2 | 2.603 | 4.300 |
| 25 | 1 | 3.303 | 6.250 |