The threshold parameter γ, provides an estimate of the earliest time a failure may occur. The threshold parameter locates the distribution along the time scale and has the same units of time, such as hours, miles, or cycles.
When γ = 0, the distribution starts at the origin.
When γ > 0, the distribution starts to the right of the origin. The period from 0 to γ is the failure-free operating period.
When γ < 0, the distribution starts to the left of the origin. For time-to-failure data, a negative γ indicates that failures occurred before the start of a test, such as during storage or transit.
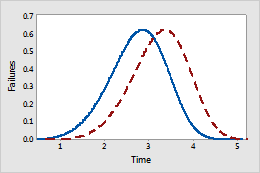
Distributions with γ = 0 and γ > 0
Both curves show Weibull distributions with shape parameters of 5 and scale parameters of 3. The distribution with greater values has a threshold parameter of 0.5.
When should I use a distribution with a threshold parameter?
Choose a distribution with a threshold parameter (3-parameter Weibull, 2-parameter exponential, 3-parameter lognormal, or 3-parameter loglogistic) to estimate the earliest time-to-failure. On a probability plot, the third parameter of the Weibull distribution is used when the data do not fall on a straight line, but fall concave down as the data decrease. The value of γ is that which plots the points in a straight line when subtracted from your data.
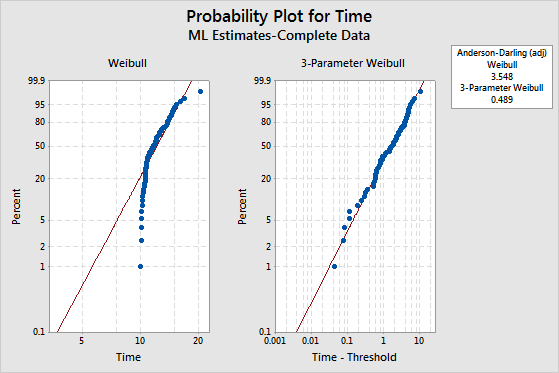
Compare data fit for a 2-parameter and 3-parameter Weibull distribution
The two probability plots show the same data fit to a Weibull and a 3-parameter Weibull distribution. The Weibull does not use the threshold parameter and displays as a curve on the probability plot. The 3-parameter Weibull adjusts for γ so that the points follow a straighter line.
Note
The threshold parameter is assumed fixed when calculating confidence intervals with the 3-parameter lognormal and 2-parameter exponential distributions.