Note
This command is available with the Predictive Analytics Module. Click here for more information about how to activate the module.
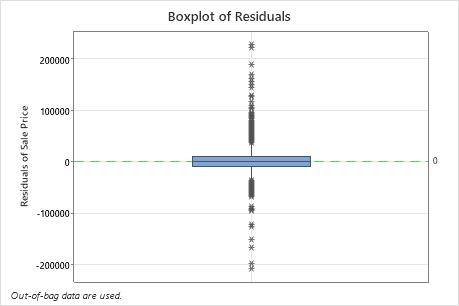
Use the boxplot of the residuals to assess the overall accuracy of
the model.
The boxplot shows the difference between the actual and fitted values. Points that are more than 1.5 times the interquartile range from the nearest quartile have individual symbols.
Interpretation
Ideally, the residuals are all close to 0, relative to the scale of the response variable. This boxplot shows that the median residuals is close to 0 but there are many large residuals, which are represented by individual symbols.
If you select validation with a test set in addition to out-of-bag validation, then the boxplot displays results for both the out-of-bag data and the test set data.