Display reference lines at one or more values on the x-axis or the y-axis. Separate multiple values with spaces.
- Show reference lines at Y values
- Enter the y-scale values to display reference lines at.
- Show reference lines at time scale positions
- Enter the x-axis values to display reference lines at.
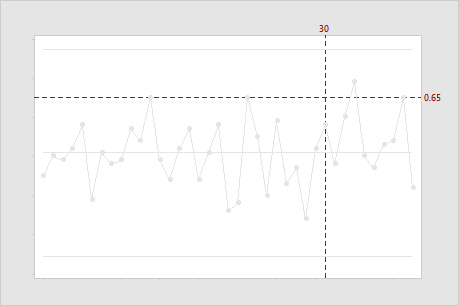
The following example shows a vertical reference line at 30 on the x-axis and a horizontal reference line at 0.65 on the y-axis.