In This Topic
Step 1: Check your data for problems
Your process should be stable and the original (or transformed) process data should follow a normal distribution. The probability plots and the fitted normal curves allow you to check for potential problems.
Assess the normality of the data
Use the normal probability plots to assess the requirement that your data follow a normal distribution.
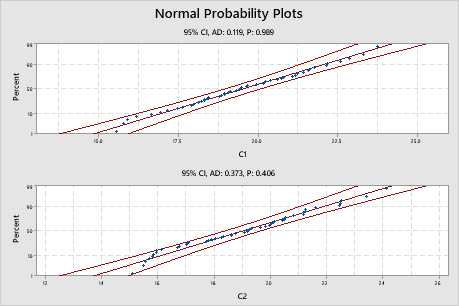
If the normal distribution is a good fit for the data, the points form an approximately straight line and fall along the fitted line that is located between the confidence bounds. Departures from this straight line indicate departures from normality. If the p-value is greater than 0.05, you can assume that the data follow the normal distribution. You can evaluate the capability of your process using a normal distribution.
- If the data for all the variables or groups is nonnormal, you can use the Transform option in this analysis to transform the data for all the variables or groups. Alternatively, you can try to fit a nonnormal distribution to the data using Nonnormal Capability Analysis for Multiple Variables.
- If the distributions differ for different variables or groups, you should perform a separate capability analysis for each variable or group with a different distribution. To evaluate the distribution of each variable or group, use Individual Distribution Identification.
Key Result: P-value
In these plots, the points in both plots fall in an approximately straight line along the fitted (middle) line. Both p-values are greater than 0.05, so you do not have enough evidence to conclude that the data for either variable is not normally distributed. Therefore, you can evaluate these data using normal capability analysis for multiple variables.
Examine the within and overall curves
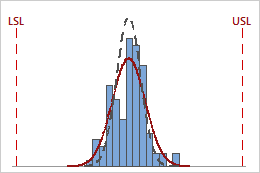
For each variable, compare the solid overall curve and the dashed within curve in the histogram to see how closely the curves are aligned. A substantial difference between the curves may indicate that the process is not stable or that there is a significant amount of variation between subgroups for that variable. Use a control chart to assess whether your process is stable for the variable before you perform a capability analysis.
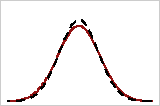
Closely aligned
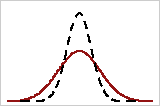
Poorly aligned
Note
If your process naturally exhibits large variation between subgroups, such as a batch process, and the variation is not due to special causes, choose the Between/Within subgroups option when you perform the normal capability analysis for multiple variables. If you use the B/W analysis, a substantial difference between the two curves may indicate a systemic source of variation in the process, in addition to the variation between and within the subgroups.
Step 2: Examine the observed performance of your process
For each group or variable in your data, use the capability histogram to visually examine the sample observations in relation to the process requirements.
Examine the process spread
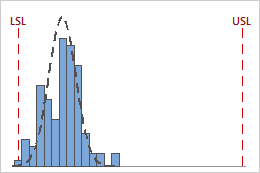
For each variable, visually examine the data in the histogram in relation to the lower and upper specification limits. Ideally, the spread of the data is narrower than the specification spread, and all the data are inside the specification limits. Data that are outside the specification limits represent nonconforming items.
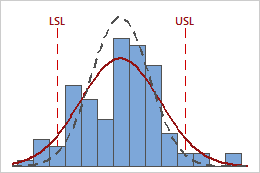
In this histogram, the process spread is larger than the specification spread, which suggests poor capability. Although most of the data are within the specification limits, there are nonconforming items below the lower specification limit (LSL) and above the upper specification limit (USL).
Note
To determine the actual number of nonconforming items in your process, use the results for PPM < LSL, PPM > USL, and PPM Total. For more information, go to All statistics and graphs.
Assess the center of the process
For each variable, evaluate whether the process is centered between the specification limits or at the target value, if you have one. The center of the data occurs at the peak of the distribution curve and is estimated by the sample mean.
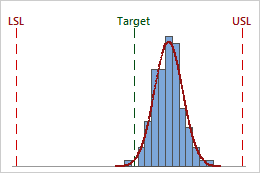
In this histogram, although the sample observations fall inside of the specification limits, the peak of the distribution curve is not centered on the target. Most of the data exceed the target value.
Step 3: Evaluate the capability of the process
Use the main capability indices to evaluate how well your process meets requirements.
Assess potential capability
Use Cpk to evaluate the potential capability of your process based on both the process location and the process spread. Potential capability indicates the capability that could be achieved if process shifts and drifts were eliminated.
Generally, higher Cpk values indicate a more capable process. Lower Cpk values indicate that your process may need improvement.
-
Compare Cpk with a benchmark that represents the minimum value that is acceptable for your process. Many industries use a benchmark value of 1.33. If Cpk is lower than your benchmark, consider ways to improve your process, such as reducing its variation or shifting its location.
- Compare the Cpk values for each variable in your analysis to determine if the potential capability of the process differs for different groups or under different conditions.
-
Compare Cp and Cpk. If Cp and Cpk are approximately equal, then the process is centered between the specification limits. If Cp and Cpk differ, then the process is not centered.
Key Result: Cpk
For the process data in this histogram, Cpk is 1.09. Because Cpk less than 1.33, the potential capability of the process does not meet customer requirements. The process is running too close to the lower specification limit. Because the process is not centered, Cpk does not equal Cp (2.76).
Assess overall capability
Use Ppk to evaluate the overall capability of your process based on both the process location and the process spread. Overall capability indicates the actual performance of your process that your customer experiences over time.
Generally, higher Ppk values indicate a more capable process. Lower Ppk values indicate that your process may need improvement.
-
Compare Ppk to a benchmark value that represents the minimum value that is acceptable for your process. Many industries use a benchmark value of 1.33. If Ppk is lower than your benchmark, consider ways to improve your process.
- Compare the Ppk values for each variable in your analysis to determine if the overall capability of the process differs for different groups or under different conditions.
-
Compare Pp and Ppk. If Pp and Ppk are approximately equal, then the process is centered between the specification limits. If Pp and Ppk differ, then the process is not centered.
-
Compare Ppk and Cpk. When a process is in statistical control, Ppk and Cpk are approximately equal. The difference between Ppk and Cpk represents the improvement in process capability that you could expect if shifts and drifts in the process were eliminated.
Key Result: Ppk
The process data in this histogram was collected prior to a process improvement. For these data, Ppk = 0.52. Because Ppk is less than 1.33, so the overall capability of the process does not meet customer requirements. Ppk < Cpk (0.72), which indicates that the overall capability could be improved if the variation between subgroups were reduced.
The process data below was collected after a process improvement. For these data, Ppk = 2.26 Because Ppk is greater than 1.33, the overall capability of the process meets customer requirements.
Important
The Cpk and Ppk indices measure the capability of the process in relation only to the specification limit that is closest to the process mean. Therefore, these indices represent only one side of the process curve, and do not measure how the process performs on the other side of the process curve. If your process produces nonconforming items that fall outside both the lower and upper specification limits, use additional capability measures in the output to more fully assess process performance. For more information, go to All statistics and graphs.