Complete the following steps to specify the data for your graph.
- From Function, select the function of the data that you want to graph.
- In Graph variables, enter multiple columns of numeric or date/time data that you want to graph.
- In Categorical variable for grouping, enter the column of categorical data that defines groups.
- From Grouping by Graph Variables, select one of the following:
- Graph variables are X-scale groups: Graph variables are the groups on the X-scale. On the graph below, graph variables are the X-scale groups.
- Graph variables are legend groups: Graph variables are the series, identified on the legend and the categorical variable defines the X-scale groups.
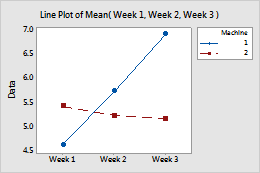
In this worksheet, Week 1, Week 2, and Week 3 are the graph variables. Machine is the categorical variable for grouping. The graph shows a series for each machine of the fill weight of a food product produced each week.
| C1 | C2 | C3 | C4 |
|---|---|---|---|
| Week 1 | Week 2 | Week 3 | Machine |
| 5.09 | 5.57 | 6.73 | 1 |
| 5.43 | 5.21 | 5.31 | 2 |
| 4.68 | 5.76 | 7.19 | 1 |
| ... | ... | ... | ... |