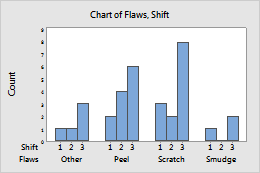
In Categorical variables (2-4, outermost first), enter two to four columns of categorical data that you want to graph. The first variable is the outermost on the scale and the last variable is the innermost. In the graph below, Flaws is the outermost categorical variable.
In this worksheet, Flaws and Shift are the categorical variables. The graph shows the counts of flaws for each work shift, clustered by flaw type.
| C1-T | C2 |
|---|---|
| Flaws | Shift |
| Scratch | 1 |
| Scratch | 2 |
| Peel | 3 |
| ... | ... |