When evaluating the relationship between two variables, it is important to determine how the variables are related. Linear relationships are most common, but variables can also have a nonlinear or monotonic relationship, as shown below. It is also possible that there is no relationship between the variables. You should start by creating a scatterplot of the variables to evaluate the relationship.
A linear relationship is a trend in the data that can be modeled by a straight line. For example, suppose an airline wants to estimate the impact of fuel prices on flight costs. They find that for every dollar increase in the price of a gallon of jet fuel, the cost of their LA-NYC flight increases by about $3500. This describes a linear relationship between jet fuel cost and flight cost.
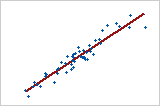
Plot 1: Strong positive linear relationship
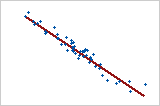
Plot 2: Strong negative linear relationship
When both variables increase or decrease concurrently and at a constant rate, a positive linear relationship exists. The points in Plot 1 follow the line closely, suggesting that the relationship between the variables is strong. The Pearson correlation coefficient for this relationship is +0.921.
When one variable increases while the other variable decreases, a negative linear relationship exists. The points in Plot 2 follow the line closely, suggesting that the relationship between the variables is strong. The Pearson correlation coefficient for this relationship is −0.968.
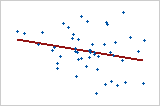
Plot 3: Weak linear relationship
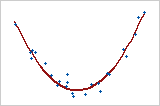
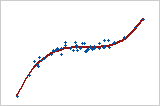
Plot 4: Nonlinear relationship
The data points in Plot 3 appear to be randomly distributed. They do not fall close to the line indicating a very weak relationship if one exists. The Pearson correlation coefficient for this relationship is −0.253.
If a relationship between two variables is not linear, the rate of increase or decrease can change as one variable changes, causing a "curved pattern" in the data. This curved trend might be better modeled by a nonlinear function, such as a quadratic or cubic function, or be transformed to make it linear. Plot 4 shows a strong relationship between two variables. However, because the relationship is not linear, the Pearson correlation coefficient is only +0.244. This relationship illustrates why it is important to plot the data in order to explore any relationships that might exist.
Plot 5: Monotonic relationship
In a monotonic relationship, the variables tend to move in the same relative direction, but not necessarily at a constant rate. In a linear relationship, the variables move in the same direction at a constant rate. Plot 5 shows both variables increasing concurrently, but not at the same rate. This relationship is monotonic, but not linear. The Pearson correlation coefficient for these data is 0.843, but the Spearman correlation is higher, 0.948.
Linear relationships are also monotonic. For example, the relationship shown in Plot 1 is both monotonic and linear.