In This Topic
Survival plot – Turnbull estimation method
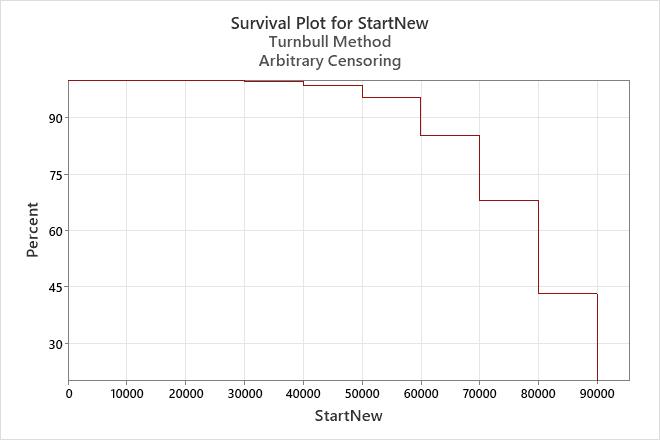
The survival plot depicts the probability that the item will survive until a particular time. Thus, plot shows the reliability of the product over time. The Y-axis displays the probability of survival and the X-axis displays the reliability measurement (time, number of copies, miles driven).
For a nonparametric analysis, the survival plot is a step function with steps at the end points of each interval. By default, the function is calculated using the Turnbull method.
Example output
Interpretation
For the new muffler data, the probability that the new type of mufflers will survive until 50,000 miles is 0.95. In other words, the mufflers have a 95% chance of surviving until 50,000 miles.
Cumulative failure plot – Turnbull estimation method
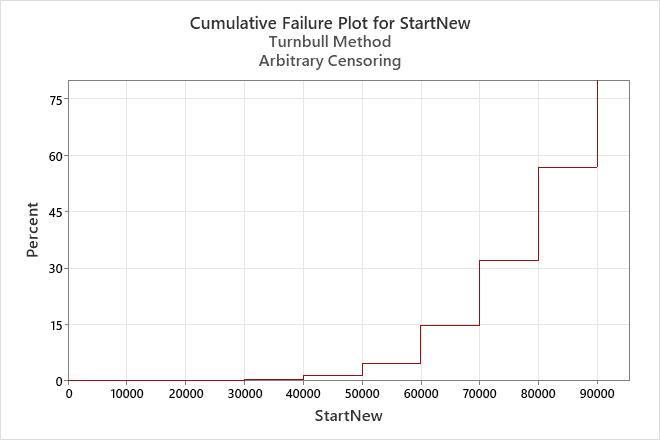
The cumulative failure plot depicts the probability that the item will fail after a particular time. Therefore, the plot shows the failure probability of the product over time. The Y-axis displays the probability of failure and the X-axis displays the reliability measurement (time, number of copies, miles driven).
For a nonparametric analysis, the cumulative failure plot is a step function with steps at the end points of each interval. By default, the function is calculated using the Turnbull method.
Example output
Interpretation
For the new muffler data, the probability that the new type of mufflers will fail by 50,000 miles is 0.05. In other words, the mufflers have a 5% chance of failing at or before 50,000 miles.
Multiple failure mode graphs – Turnbull estimation method
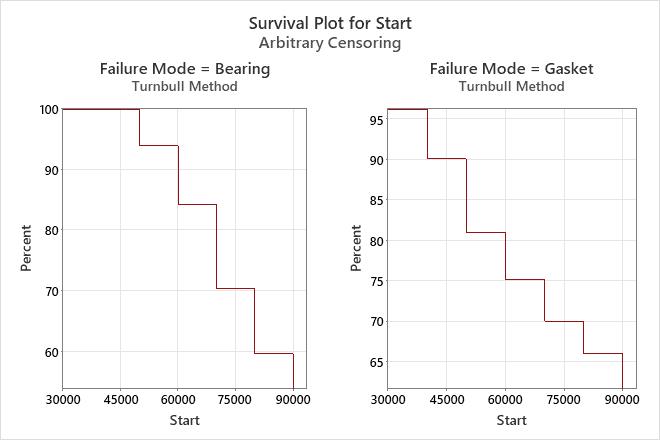
For the multiple failure data, Minitab displays graphs for each failure mode. The survival plot displays the reliability of the product over time.
Interpret each plot as if only one failure mode were present. For example, use the survival plot to assess the probability that the item will survive until a particular time.
Example output
Interpretation
For the water pump data, 84% of the water pumps survived without bearing failures for at least 60,000 miles, and 75% of the pumps survived without gasket failures for at least 60,000 miles.
To have the greatest impact on improving the reliability of the pumps, the engineers should focus on improving the gaskets.