The values in the response information table are for the response variable
and do not depend on the validation method. For an unweighted analysis the
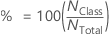
response information table includes the counts of events and non-events. The
table also shows the percentages of each class:
For a weighted analysis, the table displays information about 2 types of
weights in the response information table: class weights and case weights.
Class weights
For an analysis with class weights, Minitab provides the option to weight
the classes to ensure equal sample sizes across classes. For this type of
analysis, the most frequent class has a weight of 1. The following calculation
determines the weights for the remaining classes for a binary response:
The following calculation generalizes the class weights for a multinomial
response:
Case weights
For an analysis with case weights, the weights are in a column that has
the same number of rows as cases in the data. The weighted count for a class
has the following formula:
Notation
Term
Description
N
sample
size
weight for the
ith case in the data
indicator variable that is 1 for the class of interest and 0
otherwise