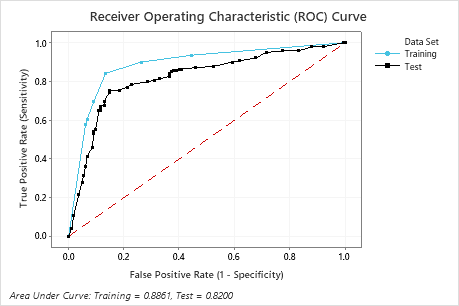
The ROC curve plots the true positive rate (TPR), also known
as power, on the y-axis. The ROC curve plots the false positive rate (FPR),
also known as type 1 error, on the x-axis. The area under an ROC curve
indicates whether the classification tree is a good classifier.
Interpretation
For classification trees, the area under the ROC curve values range from
0.5 to 1. When a classification tree can perfectly separate the classes, then
the area under the curve is 1. When a classification tree cannot separate the
classes better than a random assignment, then the area under the curve is 0.5.
The red dotted line indicates the random assignment case.
In this example, the training and test curves are similar to each
other. The area under the test curve is 0.820.