With the triangular coordinate system, you can visualize the relationships between the components in a three-component mixture. In a mixture, the components are restricted by each other in that the components must add up to the total amount or whole. Triangular coordinate systems in this section show the minimum of the x1, x2, and x3 components as 0, with the maximums at 1.
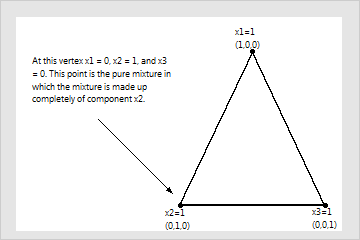
The following figure shows the usual layout of a triangular coordinate system. The components in mixture models are referred to in terms of their proportion to the whole, with the whole as 1. The vertices of the triangle represent pure mixtures (also called single-component blends). In pure mixtures, the proportion of one component is 1 and the others are 0.
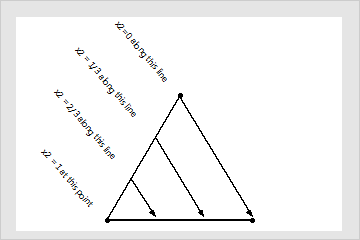
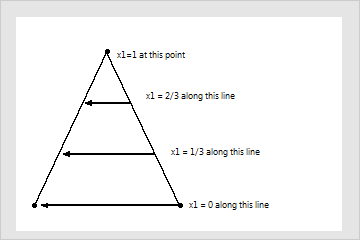
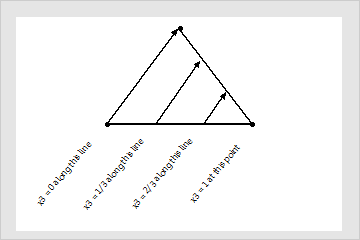
Any points along the edges of the triangle represent blends where one of the components is absent. The following figures show the location of different blends.
Now examine some points on the coordinate system.
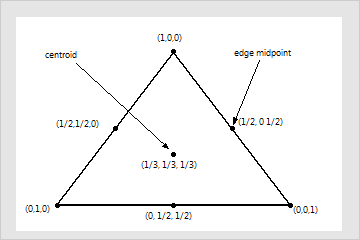
- Edge midpoints are two-blend mixtures in which one component makes up 1/2 and a second component makes up 1/2 of the mixture.
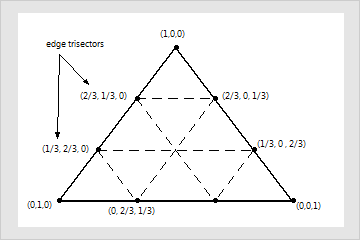
- Edge trisectors are two-blend mixtures in which one component makes up 1/3 and a different component makes up 2/3 of the mixture. These points divide the triangle edge into 3 equal parts.
- The center point (or centroid) is the complete mixture in which all components are present in equal proportions (1/3,1/3,1/3). Complete mixtures are on the interior of the design space and are mixtures in which all the components are present at the same time.