Pareto chart
The Pareto chart shows the absolute values of the standardized effects from the largest effect to the smallest effect. The standardized effects are t-statistics that test the null hypothesis that the effect is 0. The chart also plots a reference line to indicate which effects are statistically significant.
Note
If the number of terms in the model equals the number of runs, the standardized effects cannot be calculated. Minitab shows the unstandardized effects and uses Lenth's method to draw a reference line for statistical significance. For more information on Lenth's method, go to Methods and formulas for the effects plots in Analyze Variability and click "Lenth's pseudo standard error (PSE)."
Interpretation
Use the Pareto chart to determine the magnitude and the importance of the effects. On the Pareto chart, bars that cross the reference line are statistically significant. For example, in this Pareto chart, the bars that represent AB and A cross the reference line that is at 2.57. These factors are statistically significant at the 0.05 level with the current model terms.
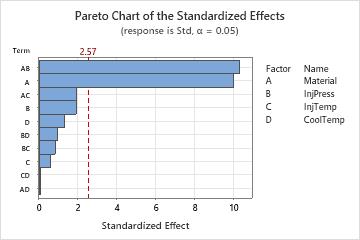
Because the Pareto chart displays the absolute value of the effects, you can determine which effects are large but you cannot determine which effects increase or decrease the response. Use the normal probability plot of the standardized effects to examine the magnitude and direction of the effects on one plot.
Normal plot of the effects
The normal probability plot of the effects shows the standardized effects relative to a distribution fit line for the case when all the effects are 0. The standardized effects are t-statistics that test the null hypothesis that the effect is 0. Positive effects increase the response when the settings change from the low value of a main effect to the high value. Negative effects decrease the response when they settings change from the low value of a main effect to the high value. Effects further from 0 on the x-axis have greater magnitude. Effects further from 0 are more statistically significant.
Note
For a 2-level design, if the number of terms in the model equals the number of runs, the standardized effects cannot be calculated. Minitab shows the unstandardized effects and uses Lenth's method to calculate the critical distance for statistical significance. For more information on Lenth's method, go to Methods and formulas for the effects plots in Analyze Variability and click "Lenth's pseudo standard error (PSE)."
Interpretation
Use the normal probability plot of the effects to determine the magnitude, direction, and the importance of the effects. On the normal probability plot of the effects, effects that are further from 0 are statistically significant. The color and shape of the points differ between statistically significant and statistically insignificant effects. For example, on this plot, the A and AB are statistically significant at the 0.05 level. These points have a different color and shape from the points for the insignificant effects.
In addition, the plot indicates the direction of the effect. Material and Material*InjPress have negative standardized effects.
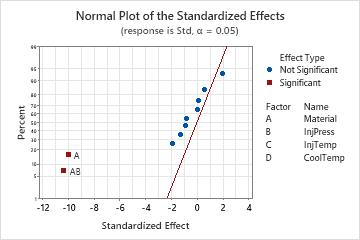
Because the normal probability plot of the effects displays negative effects on the left side of the graph and positive effects on the right side of the graph, comparisons about which effects change the response the most are more difficult than on plots that show the absolute values of the standardized effects. The half normal plot and the Pareto chart show the absolute values of the standardized effects.
Half normal plot of the effects
The half normal probability plot of the effects shows the absolute values of the standardized effects from the largest effect to the smallest effect. The standardized effects are t-statistics that test the null hypothesis that the effect is 0. The points are shown relative to a reference line for the case when all the effects are 0. Effects further from 0 on the x-axis have greater magnitude. Effects further from 0 are more statistically significant.
Note
For a 2-level design, if the number of terms in the model equals the number of runs, the standardized effects cannot be calculated. Minitab shows the unstandardized effects and uses Lenth's method to calculate the critical distance for statistical significance. For more information on Lenth's method, go to Methods and formulas for the effects plots in Analyze Variability and click "Lenth's pseudo standard error (PSE)."
Interpretation
Use the half normal probability plot of the effects to determine the magnitude and the importance of the effects. On the half normal probability plot of the effects, effects that are further from 0 are statistically significant. The color and shape of the points differ between statistically significant and statistically insignificant effects. For example, on this plot, the effects for A and AB are statistically significant at the 0.05 level. These points have a different color and shape from the points for the insignificant effects. Also, Minitab puts labels on the statistically significant points.
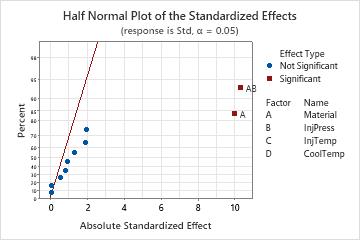
Because the half normal probability plot of the effects displays the absolute value of the effects, you can determine which effects are large but you cannot determine which effects increase or decrease the response. Use the normal probability plot of the standardized effects to see the magnitude and direction of the effects on one plot.