The second part of the tolerancing procedure uses
Allocate Gap
Pools.
In
Example of Calculate Gap Pools,
you calculated the gap mean and variance pools. Now, you need to specify two
sets of weights, one for each pool.
In this example, the gap mean pool is 0, so it doesn't matter how you
allocate it. You decide to make up the gap mean pool 50% by reducing the mean
in the pad, 30% by reducing the mean in the backing, and 20% by reducing the
mean in the cover.
The gap variance pool is 0.0002839, and you decide to make it up as follows:
Choose
Six Sigma > Design for Manufacturability > Allocate Gap Pools.
In
Allocation weights for Gap variance pool,
enter
'Var Alloc'.
Click
OK.
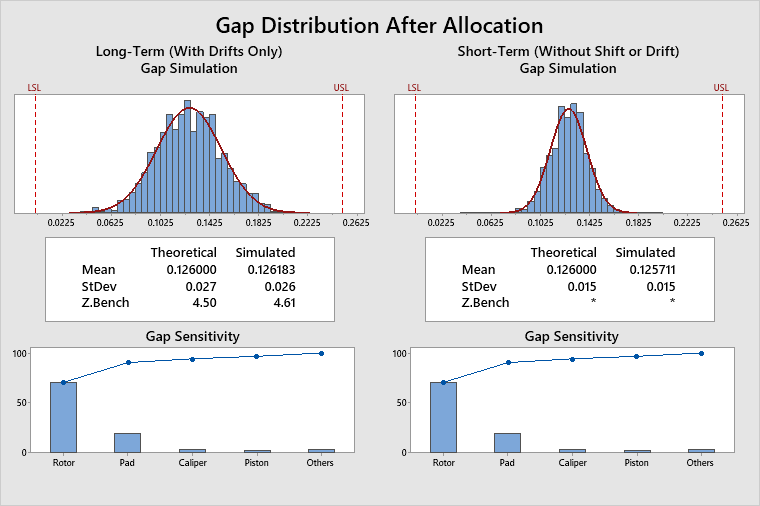
Interpret the results
As shown in the output, the long-term gap Z.Bench now equals 4.5, which is
the goal. More importantly, the design now has an overall yield of ~100%,
compared to the original design's overall yield of 46.91%.
Note that achieving a long-term gap Z.Bench of exactly 4.5 does not always
occur with a variance pool, but it should always occur with a mean pool.
The table of adjusted means and standard deviations shows what the
short-term means and standard deviations must be for each element in the
assembly, in order to achieve the desired long-term performance of the
assembly. These values are then used to calculate the optimal tolerances for
the elements in the assembly. For more information on calculations, go to
Calculations for the specification limits for Calculate Gap Pools.
Gap Specifications
After Allocation of Gap Pools
Nominal Value 0.126
Lower Spec 0.001
Upper Spec 0.251
Required Z.Bench(LT) 4.50
Long-Term Shift 1.50
Gap Long-Term and Short-Term Statistics
Before Allocation of Gap Pools
Long-Term Short-Term
Mean 0.126000 0.126000
StDev 0.032 0.018
Z.LSL 3.94 7.09
Z.USL 3.94 7.09
Z.Bench 3.77 6.99
Gap Pool Statistics
Mean Pool 0.0000000
Variance Pool -0.0002839
Gap Long-Term and Short-Term Statistics
After Allocation of Gap Pools
Long-Term Short-Term
Mean 0.126000 0.126000
StDev 0.027 0.015
Z.LSL 4.65 8.36
Z.USL 4.65 8.36
Z.Bench 4.50 *
Element Means and Standard Deviations
After Allocation of Gap Pools
Pad 0.750 0.0047000
Backing 0.062 0.0015000
Piston 1.550 0.0016723
Cover 0.950 0.0012000
Caliper 3.700 0.0029188
Rotor 0.750 0.0125627
Overall Design Statistics
After Allocation of Gap Pools
Rolled Yield 100.00
DPU 0.0000374
Z.Bench 4.48