Interpret the key results for Tolerance Intervals (Normal Distribution)

Complete the following steps to interpret tolerance intervals.

Step 1: Assess the normality of the data

Minitab provides tolerance intervals for the normal method and the nonparametric method. If you can safely assume that your data follow a normal distribution, then you can use the normal method tolerance interval. If you cannot safely assume that your data follow a normal distribution, then you must use the nonparametric method tolerance interval.

To determine whether you can assume that the data follow a normal distribution, compare the p-value from the normality test to the significance level (α). A significance level of 0.05 indicates a 5% risk of concluding that the data do not follow a normal distribution when the data do follow a normal distribution.

P-value ≤ α: The data do not follow a normal distribution (Reject H0)
If the p-value is less than or equal to the significance level, you can conclude that your data do not follow a normal distribution. In this case, you must use the nonparametric method tolerance interval.
P-value > α: You do not have enough evidence to conclude that the data do not follow a normal distribution (Fail to reject H0)
If the p-value is larger than the significance level, you do not have enough evidence to conclude that the data do not follow a normal distribution. In this case, you can use the normal method tolerance interval.
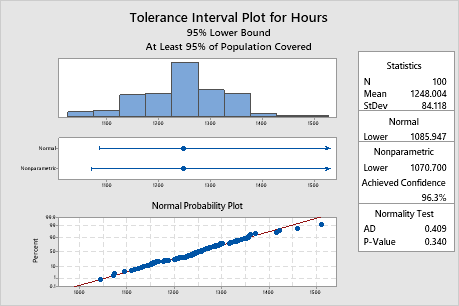
Key Results: P-Value

In these results, the p-value is 0.340, which is greater than the significance level of 0.05. Because you can assume that your data follow a normal distribution, you can use the normal method tolerance interval.

Step 2: Examine the tolerance interval from the appropriate method

Minitab provides tolerance intervals for the normal method and the nonparametric method. You can create a two-sided tolerance interval, or a one-sided tolerance interval that provides an upper bound or a lower bound.
Two-sided
Use a two-sided interval to determine the interval that contains a certain percentage of the population measurements.
Method Confidence level 98% Percent of population in interval 99%
98% Tolerance Interval Nonparametric Achieved Variable Normal Method Method Confidence C1 (-9.604, 10.813) (-9.300, 10.700) 91.0% Achieved confidence level applies only to nonparametric method.
Key Results: 98% Tolerance Interval

In this example, using the normal method, you can be 98% confident that at least 99% of all measurements are between –9.604 and 10.813 of the target value. If you cannot assume that the data are normally distributed, use the nonparametric method tolerance interval (–9.300, 10.700). For the nonparametric method, the achieved confidence is 91.0%, which is less than the target value of 98%.

Upper bound
Use an upper bound to determine the interval that indicates that a certain percentage of population measurements will not be greater than an upper limit.
Method Confidence level 95% Percent of population in interval 95%
95% Upper Tolerance Bound Normal Nonparametric Achieved Variable Method Method Confidence C1 9.043 12.000 95.1% Achieved confidence level applies only to nonparametric method.
Key Results: 95% Upper Tolerance Bound

In this example, the normal upper bound is 9.043, so you can be 95% confident that 95% of the product will have measurements of 9.043 or less. If you cannot assume that the data are normally distributed, then use the nonparametric upper bound of 12.000. For the nonparametric method, the achieved confidence is 95.1%, which is close to the target value of 95%.

Lower bound
Use a lower bound to determine the interval that indicates that a certain percentage of population measurements will not be less than a lower limit.
Method Confidence level 95% Percent of population in interval 95%
95% Lower Tolerance Bound Normal Nonparametric Achieved Variable Method Method Confidence Hours 1085.947 1070.700 96.3% Achieved confidence level applies only to nonparametric method.
Key Results: 95% Lower Tolerance Bound

In this example, the normal lower bound is 1085.947, so you can be 95% confident that at least 95% of the product will have measurements of 1085.947 or greater. If you cannot assume that the data are normally distributed, use the nonparametric lower bound of 1070.700. For the nonparametric method, the achieved confidence is 96.3%, which is greater than the target value of 95%.