Specify parameters for control limits and center lines
You can enter a single mean for the entire chart, or you can enter a mean for each stage. The mean is used to calculate the center line.
You can enter a single standard deviation for the entire chart, or you can enter a standard deviation for each stage. The standard deviation is used to calculate the control limits.
- In the dialog box, click the chart options button (for example, Xbar Options).
- In Mean, enter the mean you want Minitab to use to calculate the center line.
- In Standard deviation, enter the standard deviation that you want Minitab to use to calculate the control limits.
Create straight control limits
Default
Assume equal subgroups
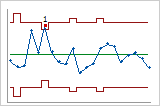
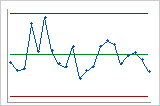
When the subgroup sizes differ, as shown on the left, the control limits are uneven. If you use the Assuming all subgroups have size option, the control limits are straight.
Important
Use this option only if the differences between the subgroup sizes are small. If the differences between subgroup sizes are large, you may affect the test results.
- In the dialog box, click the chart options button (for example, Xbar Options), and then click the Limits tab.
- Choose Assuming all subgroups have size.
- Enter a subgroup size, such as the average subgroup size, to calculate constant control limits.