In This Topic
Which tests for special causes are included in Minitab?
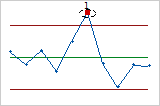
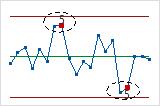
- Test 1: One point more than 3σ from center line
- Test 1 identifies subgroups that are unusual compared to other
subgroups. Test 1 is universally recognized as necessary for detecting
out-of-control situations.
If small shifts in the process are of interest, you can use Test
2 to supplement Test 1 in order to create a control chart that has greater
sensitivity.
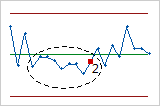
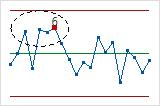
- Test 2: Nine points in a row on the same side of the center line
- Test 2 identifies shifts in the process centering or variation.
If small shifts in the process are of interest, you can use Test
2 to supplement Test 1 in order to create a control chart that has greater
sensitivity.
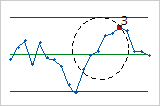
- Test 3: Six points in a row, all increasing or all decreasing
- Test 3 detects trends. This test looks for a long series of
consecutive points that consistently increase in value or decrease in value.
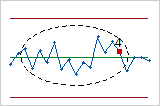
- Test 4: Fourteen points in a row, alternating up and down
- Test 4 detects systematic variation. You want the pattern of
variation in a process to be random, but a point that fails Test 4 might
indicate that the pattern of variation is predictable.
- Test 5: Two out of three points more than 2σ from the center line (same side)
- Test 5 detects small shifts in the process.
- Test 6: Four out of five points more than 1σ from center line (same side)
- Test 6 detects small shifts in the process.
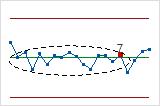
- Test 7: Fifteen points in a row within 1σ of center line (either side)
- Test 7 detects a pattern of variation that is sometimes mistaken as
evidence of good control. This test detects control limits that are too wide.
Control limits that are too wide are often caused by stratified data, which
occur when a systematic source of variation is present within each subgroup.
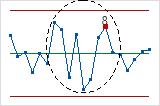
- Test 8: Eight points in a row more than 1σ from center line (either side)
- Test 8 detects a mixture pattern. In a mixture pattern, the points
tend to fall away from the center line and instead fall near the control
limits.
Which tests should I use to detect specific patterns of special-cause variation?
Apply certain tests based on your knowledge of the process. If it is likely that your data might contain particular patterns, you can look for them by choosing the appropriate test. Adding more tests makes the chart more sensitive, but may also increase the chance of getting a false signal. When you use several tests together, the chance of obtaining a signal for lack-of-control increases.
Variables charts
- Test 1 (a point outside the control limits) detects a single out-of-control point.
- Test 2 (9 points in a row on one side of the center line) detects a possible shift in the process.
- Test 7 (too many points in a row within 1 standard deviation of the center line) detects control limits that are too wide. Wide control limits are often caused by stratified data, which occur when you have a systematic source of variation within each subgroup.
Attributes charts
- Test 1 (a point outside the control limits) detects a single out-of-control point.
- Test 2 (9 points in a row on one side of the center line) detects a possible shift in the process.
Rare event charts
- G charts
-
Experts recommend that you use both Test 1 and Test 2 when you create a G chart because the G chart may be slow to detect small to moderate decreases in the average number of days or number of opportunities between events.
To detect high rates of an event on a G chart, Minitab also includes the Benneyan test. The minimum data value for a G chart is 0. In most cases, the lower control limit for a G chart is also 0. Thus, in most cases, no points on a G chart can be below the lower control limit. The Benneyan test fails if there are too many consecutive points that equal 0.
- T charts
-
Experts recommend that you use both Test 1 and Test 2 when you create a T chart because the T chart may be slow to detect small to moderate decreases in the average time between events.
Which tests are available with my control chart?
Tests 1−8 are available for most variables control charts. Note that only tests 1−4 are available for R, S, and moving range charts.
Tests 1−4 are available for the attribute control charts.
On time-weighted control charts, Minitab only performs a test for points that go beyond the control limits. The other seven tests assume that the points are independent. Because the plotted points on time-weighted charts combine information from previous subgroups, the points are not independent.
How do I specify tests and parameters for a control chart?
When you create most control charts, you can select the tests to perform and change the parameters for each test. For example, suppose that you create an Xbar chart and you want to perform tests 1, 2, and 7. In addition, you want to draw control limits at 2.5σ instead of 3σ so that it is easier for points to fail test 1.
- Choose .
- Complete the dialog box as usual.
- Click Xbar Options, then click the Tests tab.
-
Select the following:
- 1 point > K standard deviations from center line
- K points in a row on same side of center line
- K points in a row within 1 standard deviation of center line (either side)
-
Next to
1 point > K standard deviations from center line,
enter
2.5.
The control limits will be drawn at 2.5σ instead of 3σ. Points will fail test 1 if they are more than 2.5 sigma from the center line.
- Click OK in each dialog box.
How do I change the default tests and test parameters?
You can change the default tests and test parameters for future sessions of Minitab. For example, suppose you want to perform all test for special causes whenever you create a control chart. In addition, you want to draw the control limits for all control charts at 2.5σ instead of 3σ.
- Choose .
-
From the drop-down list, select
Perform all tests for special causes.
Minitab will now perform all applicable tests when you create a control chart.
-
Next to
1 point > K standard deviations from center line,
enter
2.5.
The control limits for control charts will be drawn at 2.5σ by default. Points will fail test 1 if they are more than 2.5σ from the center line.
Note
This procedure will not undo any changes that you have made in the Tests tab for specific graphs in existing projects. For example, if you previously modified the parameters for an Xbar chart in the current project, Minitab will remember your settings for that chart. The new defaults will not be applied to Xbar charts in the current project.