In This Topic
Step 1: Determine whether the process mean is in control
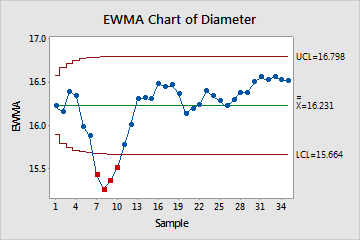
The EWMA chart plots the exponentially weighted moving averages. Each plotted point incorporates information from all the previous subgroups or observations based on the weight that you specify. The center line is the process average. The control limits, which are set at a distance of 3 standard deviations above and below the center line, show the amount of variation that is expected in the observations.
Red points indicate points that are more than 3 standard deviations above or below the center line. If the chart shows out-of-control points, investigate those points. Out-of-control points can influence the estimation of process parameters and result in control limits that do not truly represent your process. If you have out-of-control points that are due to special causes, consider omitting these points from the calculations. For more information, go to Specify how to estimate the parameters for EWMA Chart.
In these results, 4 points are below the lower control limit. A shift in the process level appears to occur, starting at point 5. You should examine the process for special-cause variation.
When you hold the pointer over a red point, you can get more information about this observation.
Step 2: Identify which points failed the test
Investigate any subgroups that fail the tests for special causes. By default, Minitab conducts only Test 1, which detects points that fall outside of the control limits. However, if you conduct additional tests, then points can fail multiple tests. The output shows exactly which points failed each test, as shown here.
Test Results for EWMA Chart of Diameter
| TEST 1. One point more than 3.00 standard deviations from center line. |
|---|
| Test Failed at points: 7, 8, 9, 10 |