Use U Chart Diagnostic to test for overdispersion or underdispersion in your defects data. You must be able to count the number of defects on each item or unit. Overdispersion can cause a traditional U chart to show an increased number of points outside the control limits. Underdispersion can cause a traditional U chart to show too few points outside of the control limits. The Laney U' chart adjusts for these conditions.
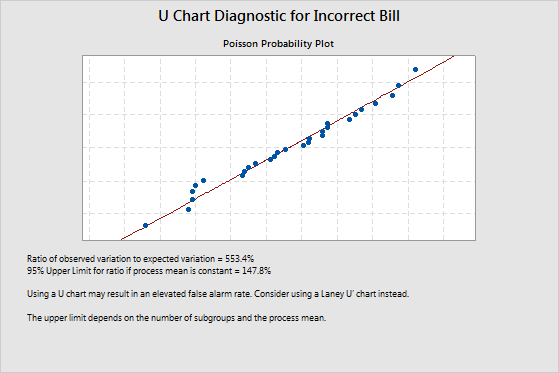
For example, the manager of the billing department at a hospital wants to track the number of errors in the bills that the hospital sends to patients. Because the volume of bills is high, the manager uses a U chart diagnostic test to check for overdispersion in the data. The ratio of observed variation to expected variation is 553.4%. This value indicates overdispersion because it is greater than the upper confidence limit of 147.8%. The manager should use a Laney U' chart instead of a traditional U chart to track the defect rate.
Where to find this analysis
To perform a U chart diagnostic test, choose .
When to use an alternate test
If you can determine only whether each item is defective or nondefective, use P Chart Diagnostic.