In This Topic
PPM < LSL for Observed Performance
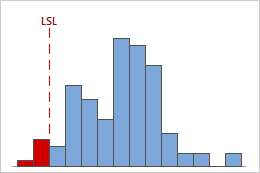
In this histogram, the red bars represent the measurements that are less than the lower specification limit in the sample data.
Interpretation
Use PPM < LSL for observed performance to assess the actual number of nonconforming items, represented in parts per million, that are below the lower specification limit in your sample data.
Lower values of PPM < LSL indicate greater process capability, relative to the lower specification limit. Ideally, few or no parts have measurements that are less than the lower specification limit.
PPM > USL for Observed Performance
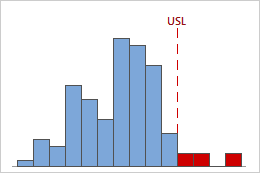
In this histogram, the red bars represent the measurements that are greater than the upper specification limit in the sample data.
Interpretation
Use PPM > USL for observed performance to assess the actual number of nonconforming items, represented in parts per million, that are above the upper specification limit in your sample data.
Lower values of PPM > USL indicate greater process capability, relative to the upper specification limit. Ideally, few or no parts have measurements that are greater than the upper specification limit.
PPM Total for Observed Performance
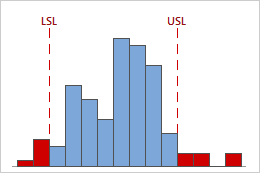
In this histogram, the red bars represent the measurements that are outside the specification limits in the sample data.
Interpretation
Use PPM Total for observed performance to assess the actual number of nonconforming items, represented in parts per million, that are outside the specification limits in your sample data.
Lower values of PPM Total indicate greater process capability. Ideally, few or no parts have measurements that are outside the specification limits.
| PPM | % Nonconforming Parts | % Conforming |
|---|---|---|
| 66807 | 6.6807% | 93.3193% |
| 6210 | 0.621% | 99.379% |
| 233 | 0.0233% | 99.9767% |
| 3.4 | 0.00034% | 99.99966% |
% < LSL for Observed Performance
In this histogram, the red bars represent the measurements that are less than the lower specification limit in the sample data.
Interpretation
Use % < LSL for observed performance to assess the percentage of nonconforming items that are below the lower specification limit in your sample data.
Lower values of % < LSL indicate greater process capability, relative to the lower specification limit. Ideally, few or no parts have measurements that are less than the lower specification limit.
% > USL for Observed Performance
In this histogram, the red bars represent the measurements that are greater than the upper specification limit in the sample data.
Interpretation
Use % > USL for observed performance to assess the percentage of nonconforming items that are above the upper specification limit in your sample data.
Lower values of % > USL indicate greater process capability, relative to the upper specification limit. Ideally, few or no parts have measurements that are greater the upper specification limit.
% Total for Observed Performance
In this histogram, the red bars represent the measurements that are outside the specification limits in the sample data.
Interpretation
Use % Total for observed performance to assess the percentage of nonconforming items that are outside the specification limits in your sample data.
Lower values of % Total indicate greater process capability. Ideally, few or no parts have measurements that are outside the specification limits.