A representative from a sales department purchases pens from a vendor to give away at trade shows. Each shipment of pens has a lot size of 5000 pens. The sales representative wants to implement a sampling plan so that the entire lot of pens is either accepted or rejected. The sales representative and the vendor agree that the AQL for the sampling plan is 1.5% and that the RQL is 10%.
- Choose .
- From the drop-down list, select Create a Sampling Plan.
- In Measurement type, select Go / no go (defective).
- In Units for quality levels, select Percent defective.
- In Acceptable quality level (AQL), enter 1.5.
- In Rejectable quality level (RQL or LTPD), enter 10.
- In Producer’s risk (Alpha), enter 0.05.
- In Consumer’s risk (Beta), enter 0.10.
- In Lot size, enter 5000.
- Click OK.
Interpret the results
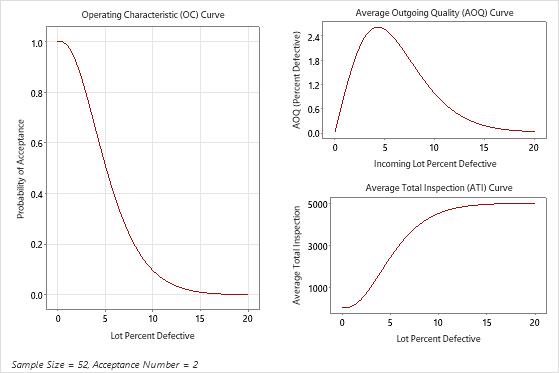
For each lot of 5000 pens, the sales representative should randomly select and inspect 52 pens. If more than 2 defectives pens are found, the sales representative rejects the entire lot. For 2 or less defective pens, the sales representative accepts the entire lot.
In this case, the probability of acceptance at the AQL (1.5%) is 0.957 and the probability of rejecting is 0.043. The sales representative and vendor agreed that lots of 1.5% defective would be accepted approximately 95% of the time to protect the producer. The probability of accepting at the RQL (10%) is 0.097 and the probability of rejecting is 0.903. The sales representative and vendor agreed that lots of 10% defective would be rejected most of the time to protect the consumer.
- The average outgoing quality (AOQ) represents the average quality of the lot after the additional inspection and rework. The AOQ level is 1.4% at the AQL and 1.0% at the RQL. The average outgoing quality limit (AOQL) = 2.603 at 4.300 percent defective and represents the worse case outgoing quality level.
- The average total inspection (ATI) represents the average number of inspected items after the additional inspection and rework. The ATI per lot represents the average number of pens inspected at a particular quality level and probability of acceptance. For the quality level of 1.5% defective, the average total number of pens inspected per lot is 266.2. For the quality level of 10% defective, the average total number of pens inspected per lot is 4521.9.
Method
| Acceptable Quality Level (AQL) | 1.5 |
|---|---|
| Producer’s Risk (α) | 0.05 |
| Rejectable Quality Level (RQL or LTPD) | 10 |
| Consumer’s Risk (β) | 0.1 |
Generated Plan(s)
| Sample Size | 52 |
|---|---|
| Acceptance Number | 2 |
| Percent Defective | Probability Accepting | Probability Rejecting | AOQ | ATI |
|---|---|---|---|---|
| 1.5 | 0.957 | 0.043 | 1.420 | 266.2 |
| 10.0 | 0.097 | 0.903 | 0.956 | 4521.9 |
Average Outgoing Quality Limit(s) (AOQL)
| AOQL | At Percent Defective |
|---|---|
| 2.603 | 4.300 |