View Single
Create a plot that shows a single distribution with the parameters that you specify. For example, this plot shows a chi-square distribution with 4 degrees of freedom.
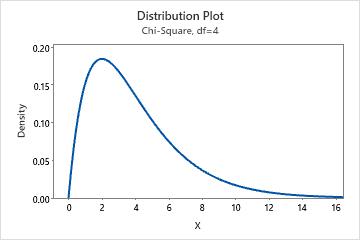
For more information, go to Create a single probability distribution plot.
Vary Parameters
Create a plot that shows the specified distribution with different parameter values. Use to view how varying parameters affects a distribution. For example, this plot shows four normal distributions with different mean and standard deviation values.
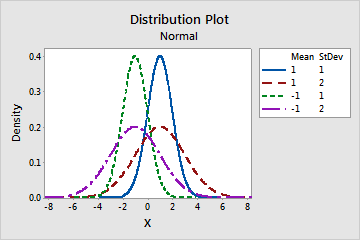
For more information, go to Create a probability distribution plot with varying parameters.
Two Distributions
Create a plot that shows two distributions with the parameters that you specify. Use to compare curves based on two different distribution functions. For example, this plot shows a t-distribution with 1 degree of freedom, and a standard normal distribution with mean = 0 and standard deviation = 1.
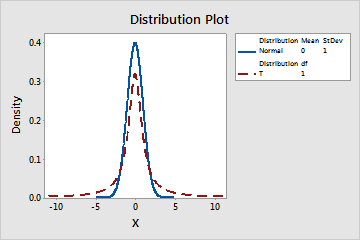
For more information, go to Create a probability distribution plot with two distributions.
View Probability
Create a plot that shows x-values and probabilities in a shaded area. For example, this plot shows the x-value for a specified probability.
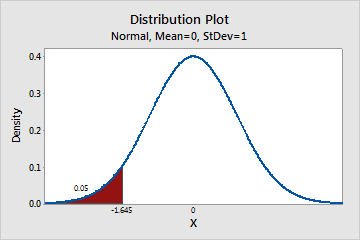
For more information, go to Create a probability distribution plot with shaded areas.