An epidemiologist wants to determine how a virus spread throughout the population of four different regions. The number of infections were recorded each day for six months. For each region, the number of infections are split into two age categories.
- Open the sample data, Infections.MWX.
- Choose .
- In Graph variables, enter Infections.
- From Function, select Sum.
- In Row variables, enter Region and Age.
- In Column variables, enter Month.
- From Gradient type, select Sequential from low to high.
- Click OK.
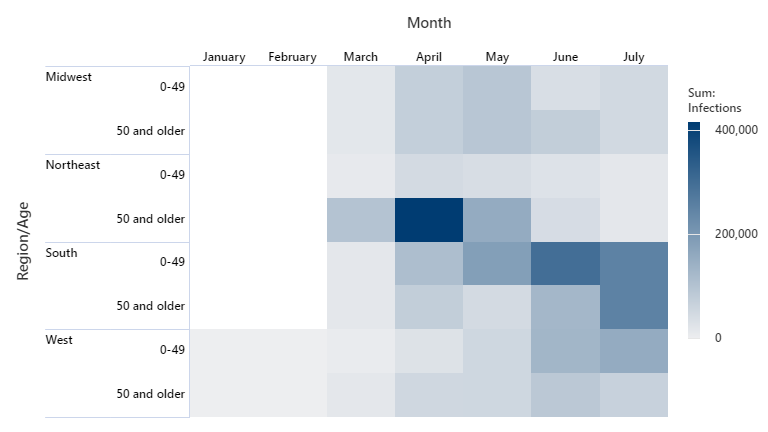
Interpret the results
The West is the only region that recorded a confirmed case in the months of January and February. However, the number of infections exploded in the older population of the Northeast in March and April. The epidemiologist suspects that the lack of confirmed cases in January and February is due to limited testing. Additionally, the epidemiologist wants to determine what factors led to such a high number of cases in that region during that time period so they can use that information to limit the spread in other regions.
Infections in the South region increased in the younger population each month from March until June. June and July have seen an increase in the South region for the older population. An epidemiologist decides that the increase in rates of the younger population might have led to an increase of cases in the older population.