In Graph variables, enter one or more numeric or date/time columns that you want to graph. Minitab creates a separate graph for each column.
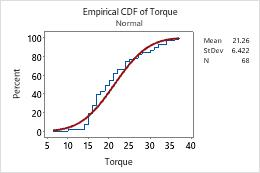
In this worksheet, Torque is the graph variable. The graph shows the distribution of torque values.
| C1 |
|---|
| Torque |
| 24 |
| 14 |
| 18 |
| ... |
Note
For information on options for fitted distribution lines, go to Fitted distribution lines.