Look for rectangles that have the darkest colors to determine which sets of variables have the highest Pearson correlation coefficients, which sets have the lowest, or both.
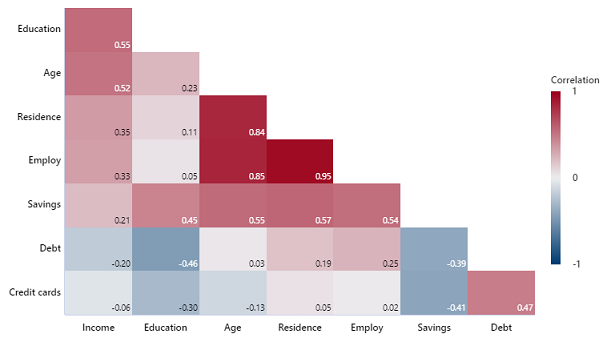
In this example, the highest Pearson correlation coefficient is between Employ and Residence. This value of 0.95 represents a positive relationship between the variables. As employment increases, residence also increases. Age also has a strong positive relationship with Residence and Employ.
The Pearson correlation coefficient between Debt and Education is –0.46. As an applicant's education level decreases, the debt increases. Overall, most pairs of variables have a positive correlation.