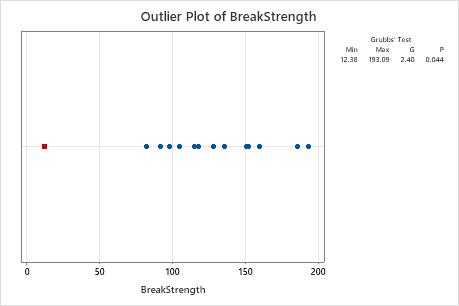
Use the outlier plot to visually identify an outlier in the data.
You are now leaving support.minitab.com.
Click Continue to proceed to: