An environmental engineer measures the suspended sediment in the water at two locations of a river over 15 days. The engineer expects a correlation between the two locations. Because one location is farther downstream, the engineer expects that the correlation pattern is consistent with the time that is needed for water to move between the two locations.
The engineer performs a cross correlation analysis to determine the number of days that the water takes to move upstream to downstream.
- Open the sample data, RiverSediment.MWX.
- Choose .
- In First series, enter Upstream.
- In Second series, enter Downstream.
- Click OK.
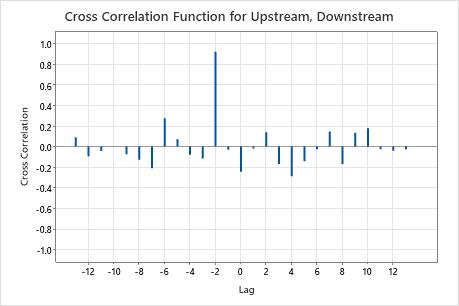
Interpret the results
The cross correlation function shows a large spike for lag −2. Usually, The value of approximately 0.92 is significantly different than 0 because it is greater than 0.55 =  . This is a rule of thumb calculation that indicates that the correlation is more than 2 standard deviations from 0. The engineer can conclude that the water moves from the upstream location to the downstream location in two days.
Cross Correlations
| Lag | CCF |
|---|---|
| -13 | 0.088605 |
| -12 | -0.094967 |
| -11 | -0.044034 |
| -10 | 0.002249 |
| -9 | -0.075707 |
| -8 | -0.129418 |
| -7 | -0.211479 |
| -6 | 0.274646 |
| -5 | 0.070625 |
| -4 | -0.080266 |
| -3 | -0.116391 |
| -2 | 0.919857 |
| -1 | -0.030654 |
| 0 | -0.244537 |
| 1 | -0.020511 |
| 2 | 0.137672 |
| 3 | -0.169664 |
| 4 | -0.288815 |
| 5 | -0.143804 |
| 6 | -0.027369 |
| 7 | 0.144552 |
| 8 | -0.169233 |
| 9 | 0.133472 |
| 10 | 0.176201 |
| 11 | -0.026856 |
| 12 | -0.041351 |
| 13 | -0.026638 |