When the effect of one factor depends on the level of the other factor. You can use an interaction plot to visualize possible interactions.
Parallel lines in an interaction plot indicate no interaction. The greater the difference in slope between the lines, the higher the degree of interaction. However, the interaction plot doesn't alert you if the interaction is statistically significant.
Example of an interaction plot
For example, cereal grains must be dry enough before the packaging process. Lab technicians collect moisture data on grains at several oven times and temperatures.
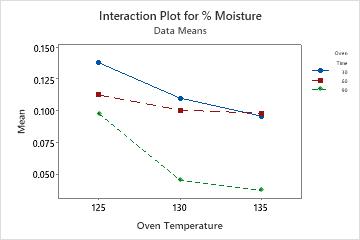
This plot indicates an interaction between the oven temperature and oven time. The grain has a lower moisture percentage when baked for a time of 60 minutes as opposed to 30 minutes at 125 and 130 degrees. However, when the temperature is 135 degrees, the grain has a lower moisture percentage when baked for 30 minutes.
Interaction plots are most often used to visualize interactions during ANOVA or DOE.
Minitab draws a single interaction plot if you enter two factors, or a matrix of interaction plots if you enter more than two factors.
Which interaction plots are available in Minitab?
- to generate interaction plots specifically for factorial designs.
- to generate interaction plots specifically for process variables in mixture designs.
- to generate interaction plots for the fitted values from doing an analysis of variance.
- and then choose either , , or to generate interaction plots from a regression model.
Note
All of these options let you use fitted means. Usually, plots using fitted values and plots created by the Interaction Plot command using the response will not be the same. They will be the same if the data set is balanced and you fit a full model.